
- Start >
- Rivers >
- Discharge >
- Unterer Main >
- Hafenlohr >
- Chart of year

Chart of year Hafenlohr / Hafenlohr
Discharge from 01.01.2017 to 31.12.2017
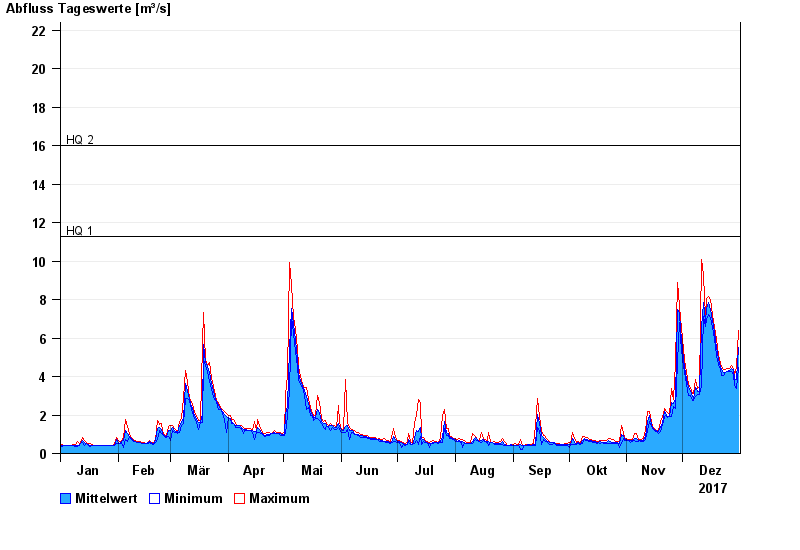
- HQ1 11,3 m³/s
- HQ2 16 m³/s
- HQ5 23 m³/s
- HQ10 28 m³/s
- HQ20 33 m³/s
- HQ50 40 m³/s
- HQ100 45 m³/s
| Date | Mean value [m³/s] | Maximum [m³/s] | Minimum [m³/s] |
|---|---|---|---|
| 31.12.2017 | 5.5 | 6.4 | 4.47 |
| 30.12.2017 | 3.85 | 4.47 | 3.39 |
| 29.12.2017 | 3.84 | 4.13 | 3.53 |
| 28.12.2017 | 4.36 | 4.44 | 4.13 |
| 27.12.2017 | 4.43 | 4.59 | 4.26 |
| 26.12.2017 | 4.32 | 4.42 | 4.25 |
| 25.12.2017 | 4.27 | 4.4 | 4.24 |
© Bayerisches Landesamt für Umwelt 2024