
- Start >
- Rivers >
- Discharge >
- Unterer Main >
- Hafenlohr >
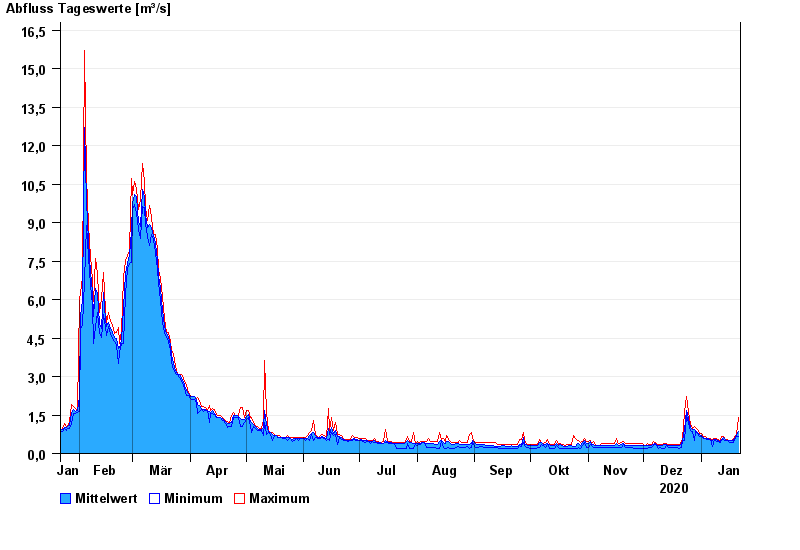
- Chart of year

Chart of year Hafenlohr / Hafenlohr
Discharge from 22.01.2020 to 21.01.2021
| Date | Mean value [m³/s] | Maximum [m³/s] | Minimum [m³/s] |
|---|---|---|---|
| 21.01.2021 | 0.849 | 1.4 | 0.681 |
| 20.01.2021 | 0.685 | 0.748 | 0.68 |
| 19.01.2021 | 0.574 | 0.68 | 0.498 |
| 18.01.2021 | 0.51 | 0.554 | 0.444 |
| 17.01.2021 | 0.494 | 0.497 | 0.444 |
| 16.01.2021 | 0.492 | 0.495 | 0.443 |
| 15.01.2021 | 0.506 | 0.549 | 0.493 |
© Bayerisches Landesamt für Umwelt 2024