
- Start >
- Rivers >
- Discharge >
- Unterer Main >
- Hafenlohr >
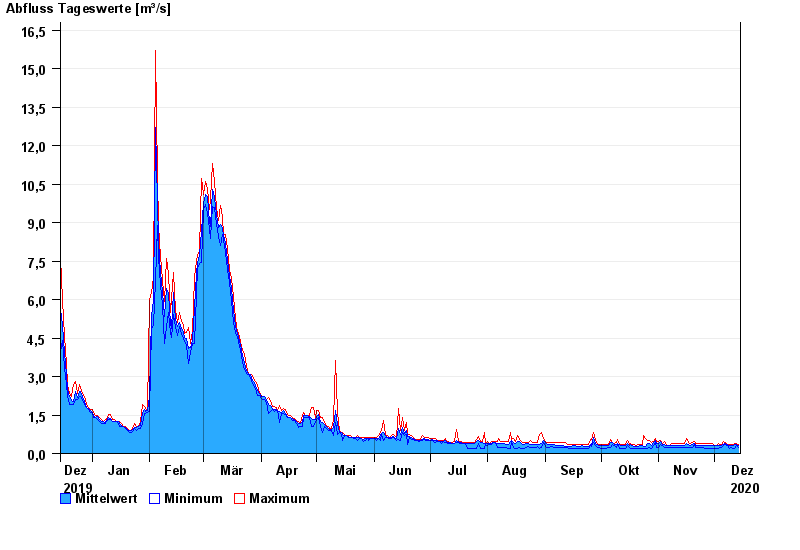
- Chart of year

Chart of year Hafenlohr / Hafenlohr
Discharge from 15.12.2019 to 14.12.2020
| Date | Mean value [m³/s] | Maximum [m³/s] | Minimum [m³/s] |
|---|---|---|---|
| 14.12.2020 | 0.327 | 0.358 | 0.24 |
| 13.12.2020 | 0.358 | 0.404 | 0.316 |
| 12.12.2020 | 0.346 | 0.404 | 0.18 |
| 11.12.2020 | 0.302 | 0.362 | 0.181 |
| 10.12.2020 | 0.311 | 0.363 | 0.244 |
| 09.12.2020 | 0.314 | 0.364 | 0.212 |
| 08.12.2020 | 0.361 | 0.366 | 0.322 |
© Bayerisches Landesamt für Umwelt 2024