
- Start >
- Rivers >
- Discharge >
- Unterer Main >
- Hafenlohr >
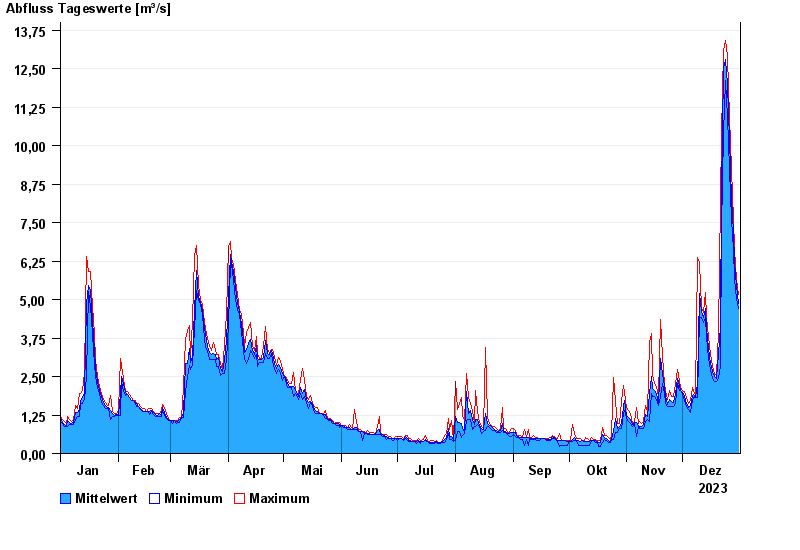
- Chart of year

Chart of year Hafenlohr / Hafenlohr
Discharge from 01.01.2023 to 31.12.2023
| Date | Mean value [m³/s] | Maximum [m³/s] | Minimum [m³/s] |
|---|---|---|---|
| 31.12.2023 | 4.86 | 5.18 | 4.7 |
| 30.12.2023 | 5.46 | 5.66 | 5.02 |
| 29.12.2023 | 6.22 | 6.63 | 5.65 |
| 28.12.2023 | 7.18 | 7.59 | 6.63 |
| 27.12.2023 | 8.27 | 9.24 | 7.59 |
| 26.12.2023 | 10.2 | 10.9 | 9.24 |
| 25.12.2023 | 12 | 12.9 | 10.9 |
© Bayerisches Landesamt für Umwelt 2024