
- Start >
- Rivers >
- Discharge >
- Unterer Main >
- Hafenlohr >
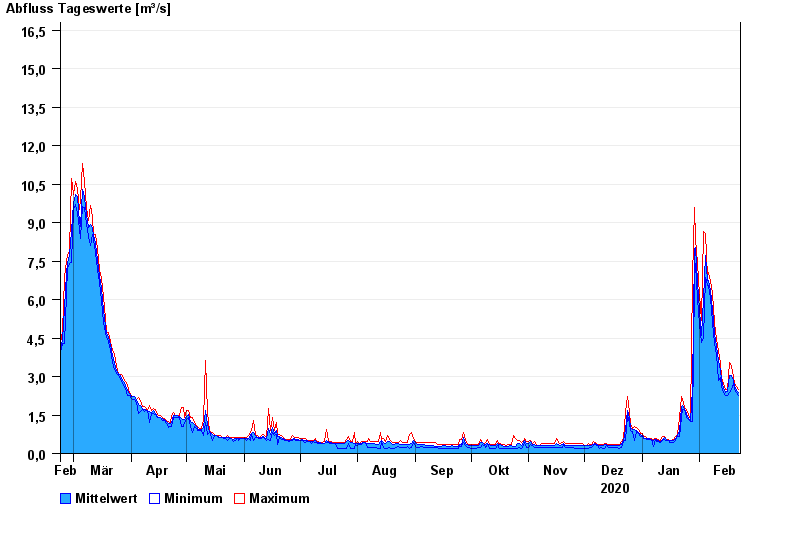
- Chart of year

Chart of year Hafenlohr / Hafenlohr
Discharge from 23.02.2020 to 22.02.2021
- 26.01.1995 Abfluss: 38,6 m³/s
- 14.01.2011 Abfluss: 34,3 m³/s
- 03.01.2003 Abfluss: 29,2 m³/s
- 21.12.1993 Abfluss: 28,6 m³/s
- 28.10.1998 Abfluss: 27,3 m³/s
| Date | Mean value [m³/s] | Maximum [m³/s] | Minimum [m³/s] |
|---|---|---|---|
| 22.02.2021 | 2.16 | 2.28 | 2.07 |
| 21.02.2021 | 2.25 | 2.28 | 2.17 |
| 20.02.2021 | 2.38 | 2.5 | 2.28 |
| 19.02.2021 | 2.59 | 2.72 | 2.5 |
| 18.02.2021 | 2.76 | 3.09 | 2.28 |
| 17.02.2021 | 2.77 | 3.21 | 2.17 |
| 16.02.2021 | 2.24 | 2.32 | 2.11 |
© Bayerisches Landesamt für Umwelt 2024