
- Start >
- Rivers >
- Discharge >
- Unterer Main >
- Hafenlohr >
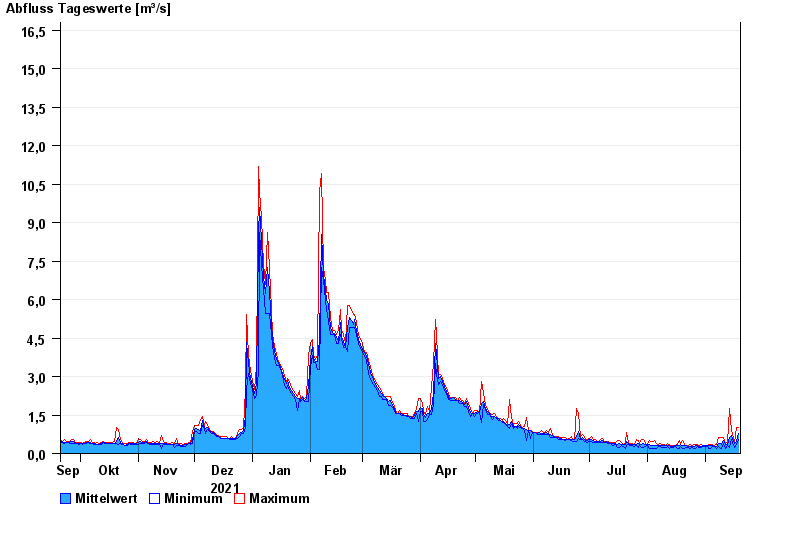
- Chart of year

Chart of year Hafenlohr / Hafenlohr
Discharge from 20.09.2021 to 19.09.2022
- 26.01.1995 Abfluss: 38,6 m³/s
- 14.01.2011 Abfluss: 34,3 m³/s
- 03.01.2003 Abfluss: 29,2 m³/s
- 21.12.1993 Abfluss: 28,6 m³/s
- 28.10.1998 Abfluss: 27,3 m³/s
| Date | Mean value [m³/s] | Maximum [m³/s] | Minimum [m³/s] |
|---|---|---|---|
| 19.09.2022 | 0.763 | 1.03 | 0.551 |
| 18.09.2022 | 0.482 | 1.03 | 0.353 |
| 17.09.2022 | 0.394 | 0.446 | 0.238 |
| 16.09.2022 | 0.455 | 0.612 | 0.312 |
| 15.09.2022 | 0.688 | 0.883 | 0.554 |
| 14.09.2022 | 0.635 | 1.77 | 0.239 |
| 13.09.2022 | 0.339 | 0.448 | 0.313 |
© Bayerisches Landesamt für Umwelt 2024