
- Start >
- Rivers >
- Discharge >
- Unterer Main >
- Hafenlohr >
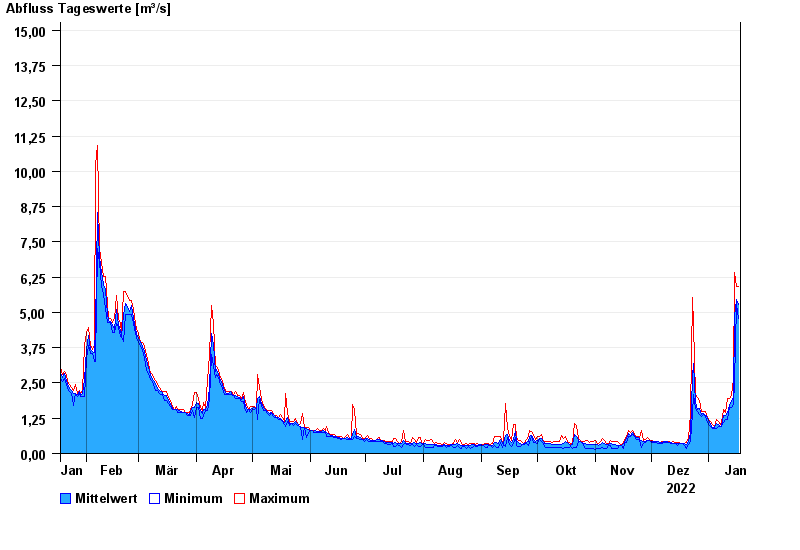
- Chart of year

Chart of year Hafenlohr / Hafenlohr
Discharge from 18.01.2022 to 17.01.2023
- 26.01.1995 Abfluss: 38,6 m³/s
- 14.01.2011 Abfluss: 34,3 m³/s
- 03.01.2003 Abfluss: 29,2 m³/s
- 21.12.1993 Abfluss: 28,6 m³/s
- 28.10.1998 Abfluss: 27,3 m³/s
| Date | Mean value [m³/s] | Maximum [m³/s] | Minimum [m³/s] |
|---|---|---|---|
| 17.01.2023 | 4.86 | 5.44 | 4.41 |
| 16.01.2023 | 5.03 | 5.44 | 4.84 |
| 15.01.2023 | 4.47 | 5.9 | 2.36 |
| 14.01.2023 | 1.88 | 2.47 | 1.67 |
| 13.01.2023 | 1.75 | 1.95 | 1.58 |
| 12.01.2023 | 1.63 | 1.85 | 1.58 |
| 11.01.2023 | 1.39 | 1.85 | 1.17 |
© Bayerisches Landesamt für Umwelt 2024