
- Start >
- Rivers >
- Discharge >
- Unterer Main >
- Hafenlohr >
- Chart of year

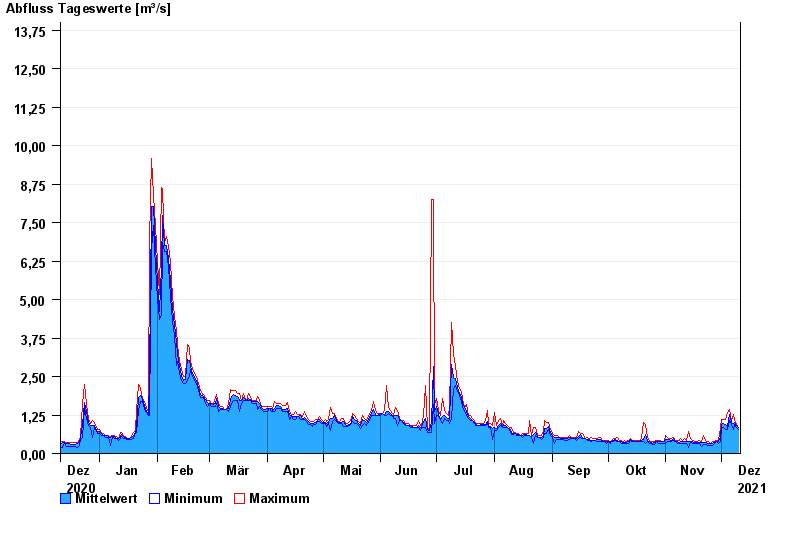
Chart of year Hafenlohr / Hafenlohr
Discharge from 11.12.2020 to 10.12.2021
- 26.01.1995 Abfluss: 38,6 m³/s
- 14.01.2011 Abfluss: 34,3 m³/s
- 03.01.2003 Abfluss: 29,2 m³/s
- 21.12.1993 Abfluss: 28,6 m³/s
- 28.10.1998 Abfluss: 27,3 m³/s
| Date | Mean value [m³/s] | Maximum [m³/s] | Minimum [m³/s] |
|---|---|---|---|
| 10.12.2021 | 0.814 | 0.815 | 0.754 |
| 09.12.2021 | 0.869 | 0.882 | 0.815 |
| 08.12.2021 | 0.952 | 1.02 | 0.882 |
| 07.12.2021 | 0.934 | 1.17 | 0.754 |
| 06.12.2021 | 0.944 | 1.02 | 0.882 |
| 05.12.2021 | 1.2 | 1.33 | 1.02 |
| 04.12.2021 | 0.85 | 1.25 | 0.754 |
© Bayerisches Landesamt für Umwelt 2024