
- Start >
- Rivers >
- Discharge >
- Unterer Main >
- Hafenlohr >
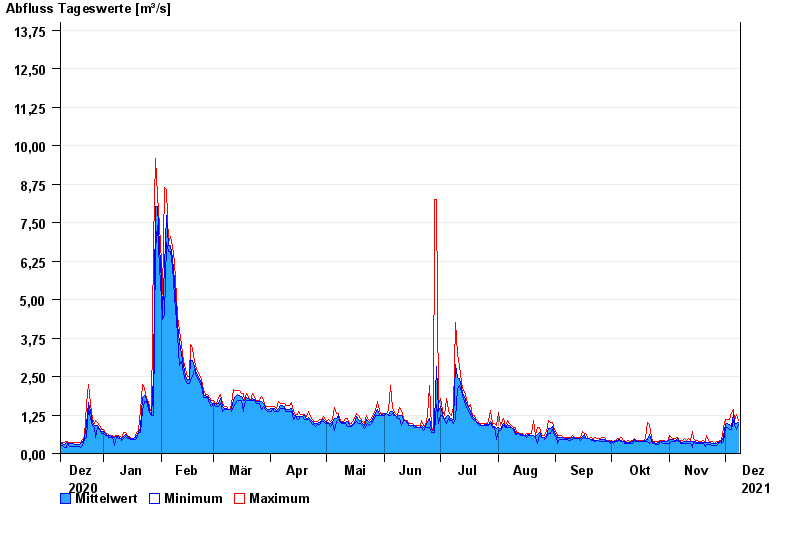
- Chart of year

Chart of year Hafenlohr / Hafenlohr
Discharge from 09.12.2020 to 08.12.2021
- 26.01.1995 Abfluss: 38,6 m³/s
- 14.01.2011 Abfluss: 34,3 m³/s
- 03.01.2003 Abfluss: 29,2 m³/s
- 21.12.1993 Abfluss: 28,6 m³/s
- 28.10.1998 Abfluss: 27,3 m³/s
| Date | Mean value [m³/s] | Maximum [m³/s] | Minimum [m³/s] |
|---|---|---|---|
| 08.12.2021 | 1.01 | 1.08 | 0.926 |
| 07.12.2021 | 0.987 | 1.26 | 0.781 |
| 06.12.2021 | 0.996 | 1.08 | 0.927 |
| 05.12.2021 | 1.28 | 1.44 | 1.08 |
| 04.12.2021 | 0.893 | 1.34 | 0.781 |
| 03.12.2021 | 0.938 | 1.09 | 0.781 |
| 02.12.2021 | 0.971 | 1.09 | 0.853 |
© Bayerisches Landesamt für Umwelt 2024