
- Start >
- Rivers >
- Discharge >
- Unterer Main >
- Hafenlohr >
- Chart of year

Chart of year Hafenlohr / Hafenlohr
Discharge from 18.09.2022 to 17.09.2023
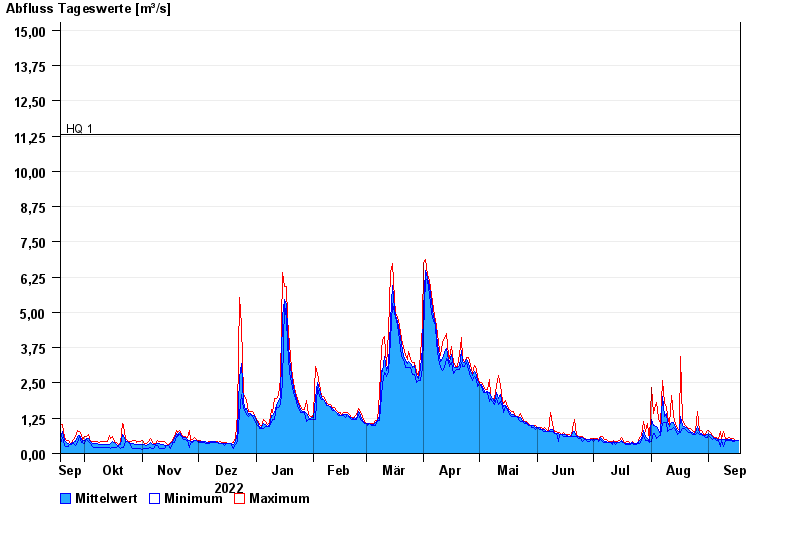
- HQ1 11,3 m³/s
- HQ2 16 m³/s
- HQ5 23 m³/s
- HQ10 28 m³/s
- HQ20 33 m³/s
- HQ50 40 m³/s
- HQ100 45 m³/s
| Date | Mean value [m³/s] | Maximum [m³/s] | Minimum [m³/s] |
|---|---|---|---|
| 17.09.2023 | 0.392 | 0.412 | 0.369 |
| 16.09.2023 | 0.407 | 0.412 | 0.369 |
| 15.09.2023 | 0.407 | 0.412 | 0.369 |
| 14.09.2023 | 0.413 | 0.457 | 0.369 |
| 13.09.2023 | 0.425 | 0.457 | 0.412 |
| 12.09.2023 | 0.43 | 0.506 | 0.412 |
| 11.09.2023 | 0.427 | 0.457 | 0.412 |
© Bayerisches Landesamt für Umwelt 2024