
- Start >
- Rivers >
- Discharge >
- Unterer Main >
- Hafenlohr >
- Chart of year

Chart of year Hafenlohr / Hafenlohr
Discharge from 13.12.2019 to 12.12.2020
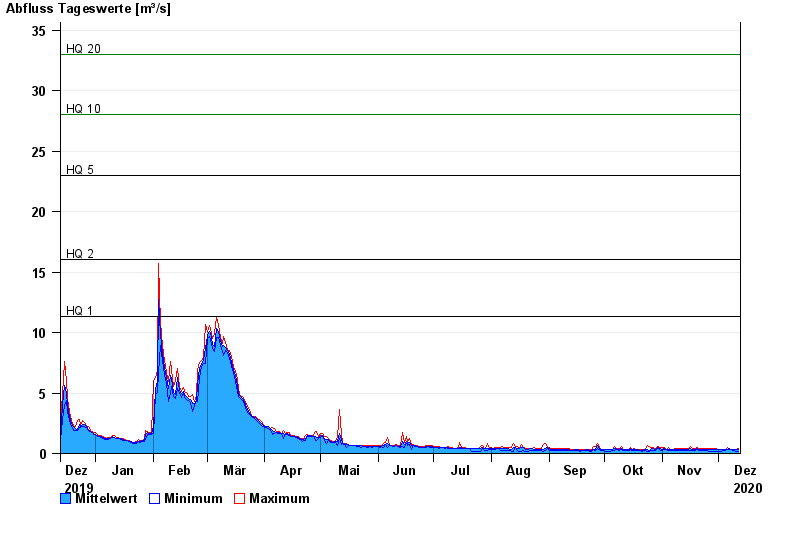
- HQ1 11,3 m³/s
- HQ2 16 m³/s
- HQ5 23 m³/s
- HQ10 28 m³/s
- HQ20 33 m³/s
- HQ50 40 m³/s
- HQ100 45 m³/s
| Date | Mean value [m³/s] | Maximum [m³/s] | Minimum [m³/s] |
|---|---|---|---|
| 12.12.2020 | 0.346 | 0.404 | 0.18 |
| 11.12.2020 | 0.302 | 0.362 | 0.181 |
| 10.12.2020 | 0.311 | 0.363 | 0.244 |
| 09.12.2020 | 0.314 | 0.364 | 0.212 |
| 08.12.2020 | 0.361 | 0.366 | 0.322 |
| 07.12.2020 | 0.38 | 0.413 | 0.366 |
| 06.12.2020 | 0.36 | 0.464 | 0.325 |
© Bayerisches Landesamt für Umwelt 2024