
- Start >
- Rivers >
- Discharge >
- Unterer Main >
- Hafenlohr >
- Chart of year

Chart of year Hafenlohr / Hafenlohr
Discharge from 01.08.2022 to 31.07.2023
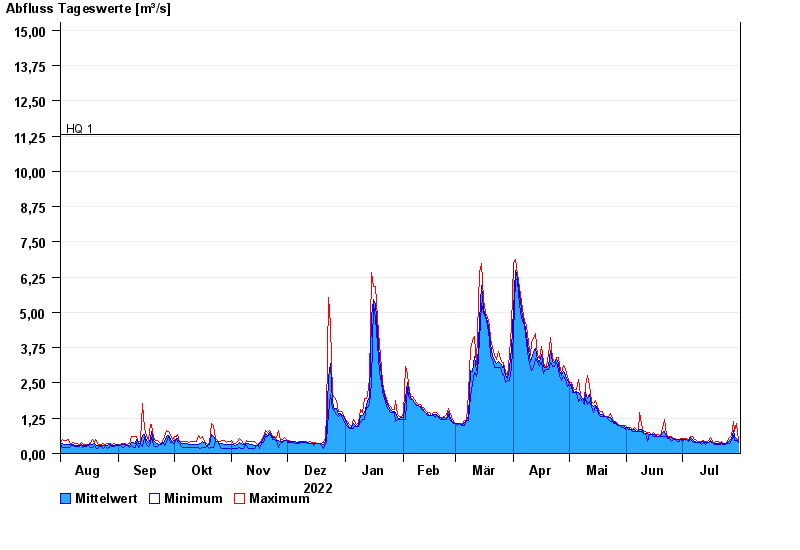
- HQ1 11,3 m³/s
- HQ2 16 m³/s
- HQ5 23 m³/s
- HQ10 28 m³/s
- HQ20 33 m³/s
- HQ50 40 m³/s
- HQ100 45 m³/s
| Date | Mean value [m³/s] | Maximum [m³/s] | Minimum [m³/s] |
|---|---|---|---|
| 31.07.2023 | 0.427 | 0.471 | 0.376 |
| 30.07.2023 | 0.544 | 1.07 | 0.47 |
| 29.07.2023 | 0.6 | 0.767 | 0.468 |
| 28.07.2023 | 0.82 | 1.14 | 0.635 |
| 27.07.2023 | 0.513 | 0.635 | 0.465 |
| 26.07.2023 | 0.467 | 0.574 | 0.37 |
| 25.07.2023 | 0.382 | 0.415 | 0.369 |
© Bayerisches Landesamt für Umwelt 2024