
- Start >
- Rivers >
- Discharge >
- Unterer Main >
- Hafenlohr >
- Chart of year

Chart of year Hafenlohr / Hafenlohr
Discharge from 01.01.2021 to 31.12.2021
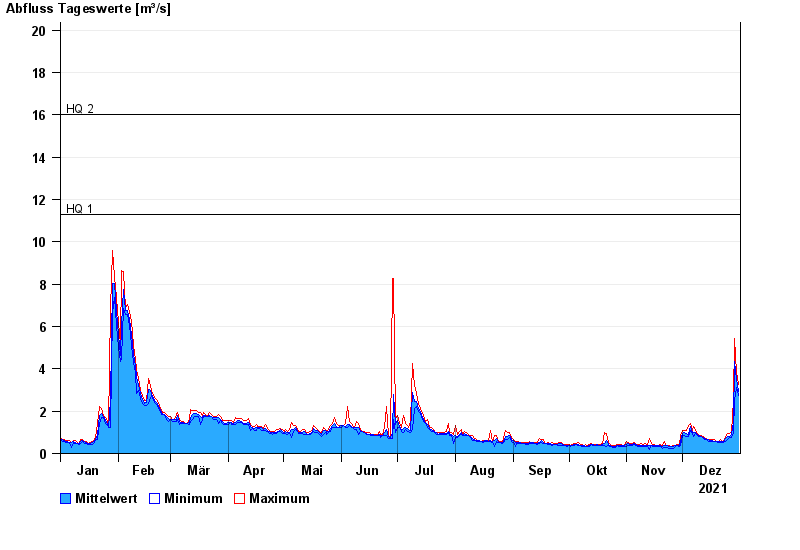
- HQ1 11,3 m³/s
- HQ2 16 m³/s
- HQ5 23 m³/s
- HQ10 28 m³/s
- HQ20 33 m³/s
- HQ50 40 m³/s
- HQ100 45 m³/s
| Date | Mean value [m³/s] | Maximum [m³/s] | Minimum [m³/s] |
|---|---|---|---|
| 31.12.2021 | 2.93 | 3.25 | 2.73 |
| 30.12.2021 | 3.49 | 3.83 | 3.11 |
| 29.12.2021 | 4.34 | 5.42 | 2.49 |
| 28.12.2021 | 1.46 | 2.49 | 1 |
| 27.12.2021 | 0.912 | 1 | 0.779 |
| 26.12.2021 | 0.809 | 0.924 | 0.779 |
| 25.12.2021 | 0.792 | 0.924 | 0.645 |
© Bayerisches Landesamt für Umwelt 2024