
- Start >
- Rivers >
- Discharge >
- Unterer Main >
- Hafenlohr >
- Chart of year

Chart of year Hafenlohr / Hafenlohr
Discharge from 01.01.2018 to 31.12.2018
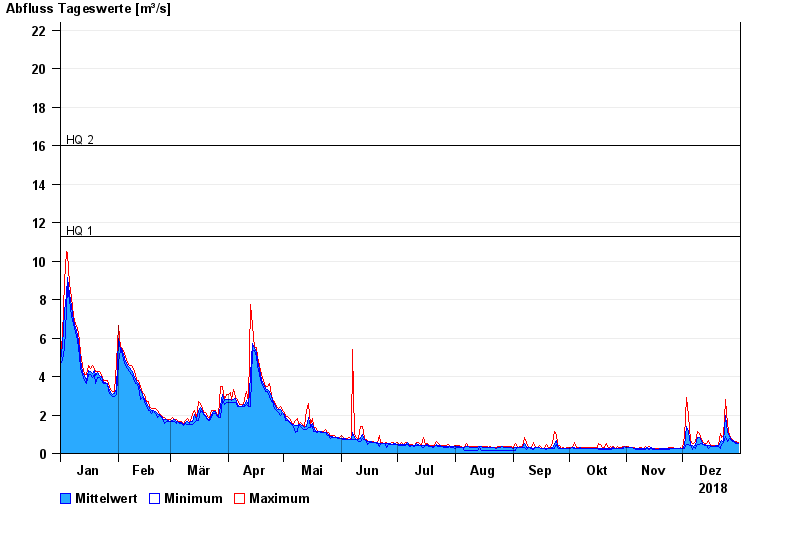
- HQ1 11,3 m³/s
- HQ2 16 m³/s
- HQ5 23 m³/s
- HQ10 28 m³/s
- HQ20 33 m³/s
- HQ50 40 m³/s
- HQ100 45 m³/s
| Date | Mean value [m³/s] | Maximum [m³/s] | Minimum [m³/s] |
|---|---|---|---|
| 31.12.2018 | 0.522 | 0.576 | 0.518 |
| 30.12.2018 | 0.579 | 0.635 | 0.518 |
| 29.12.2018 | 0.594 | 0.635 | 0.575 |
| 28.12.2018 | 0.657 | 0.699 | 0.635 |
| 27.12.2018 | 0.744 | 0.766 | 0.698 |
| 26.12.2018 | 0.866 | 0.91 | 0.766 |
| 25.12.2018 | 1.11 | 1.51 | 0.633 |
© Bayerisches Landesamt für Umwelt 2024