
- Start >
- Rivers >
- Discharge >
- Unterer Main >
- Hafenlohr >
- Chart of total period

Chart of total period Hafenlohr / Hafenlohr
Discharge from 01.11.1970 to 26.04.2024
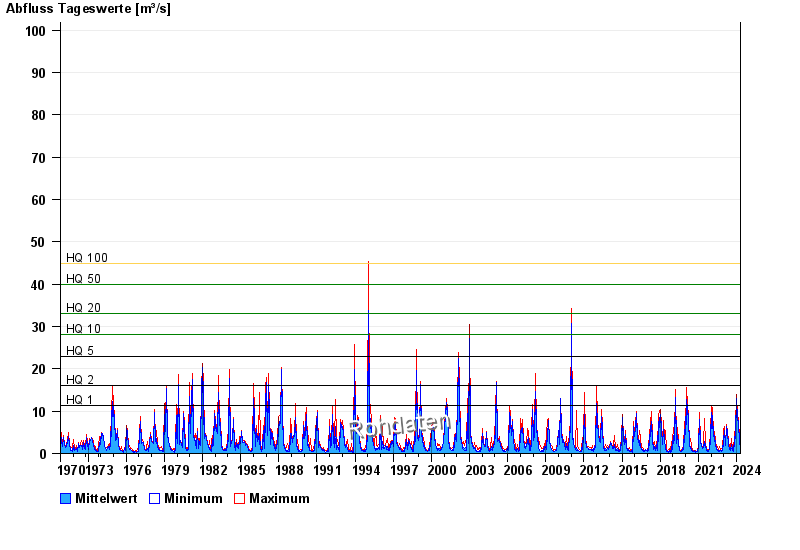
- HQ1 11,3 m³/s
- HQ2 16 m³/s
- HQ5 23 m³/s
- HQ10 28 m³/s
- HQ20 33 m³/s
- HQ50 40 m³/s
- HQ100 45 m³/s
| Date | Mean value [m³/s] | Maximum [m³/s] | Minimum [m³/s] |
|---|---|---|---|
| 26.04.2024 | 3.76 | 4.01 | 3.59 |
| 25.04.2024 | 4.04 | 4.3 | 3.86 |
| 24.04.2024 | 3.8 | 4.01 | 3.59 |
| 23.04.2024 | 3.71 | 3.86 | 3.59 |
| 22.04.2024 | 3.62 | 4.01 | 3.46 |
| 21.04.2024 | 3.64 | 4.15 | 3.07 |
| 20.04.2024 | 3.51 | 4.75 | 3.07 |
© Bayerisches Landesamt für Umwelt 2024