
- Start >
- Rivers >
- Discharge >
- Unterer Main >
- Gollmuthhausen >
- Chart of year

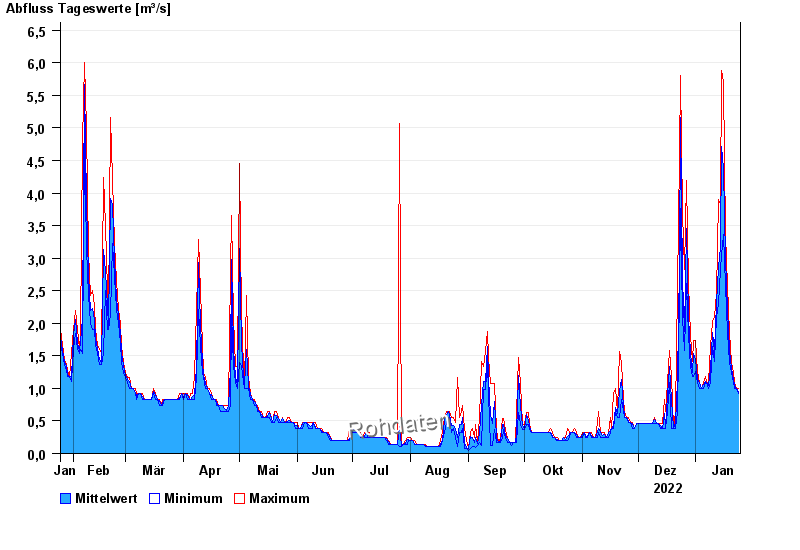
Chart of year Gollmuthhausen / Milz
Discharge from 25.01.2022 to 24.01.2023
| Date | Mean value [m³/s] | Maximum [m³/s] | Minimum [m³/s] |
|---|---|---|---|
| 24.01.2023 | 0.931 | 1 | 0.915 |
| 23.01.2023 | 1 | 1 | 1 |
| 22.01.2023 | 1.05 | 1.09 | 1 |
| 21.01.2023 | 1.14 | 1.25 | 1.09 |
| 20.01.2023 | 1.3 | 1.4 | 1.25 |
| 19.01.2023 | 1.58 | 1.86 | 1.4 |
| 18.01.2023 | 2.19 | 2.58 | 1.86 |
© Bayerisches Landesamt für Umwelt 2024