
- Start >
- Rivers >
- Discharge >
- Unterer Main >
- Gollmuthhausen >
- Chart of year

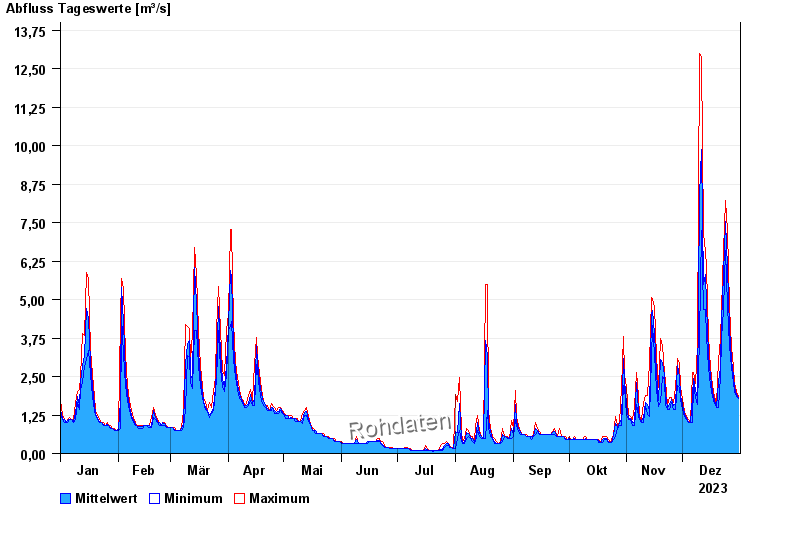
Chart of year Gollmuthhausen / Milz
Discharge from 01.01.2023 to 31.12.2023
| Date | Mean value [m³/s] | Maximum [m³/s] | Minimum [m³/s] |
|---|---|---|---|
| 31.12.2023 | 1.8 | 1.86 | 1.79 |
| 30.12.2023 | 1.91 | 2 | 1.86 |
| 29.12.2023 | 2.14 | 2.29 | 2 |
| 28.12.2023 | 2.51 | 2.79 | 2.29 |
| 27.12.2023 | 3.05 | 3.44 | 2.79 |
| 26.12.2023 | 4.06 | 4.77 | 3.51 |
| 25.12.2023 | 6.04 | 7.24 | 4.77 |
© Bayerisches Landesamt für Umwelt 2024