
- Start >
- Rivers >
- Discharge >
- Unterer Main >
- Goldbach >
- Chart of year

Chart of year Goldbach / Aschaff
Discharge from 17.10.2019 to 16.10.2020
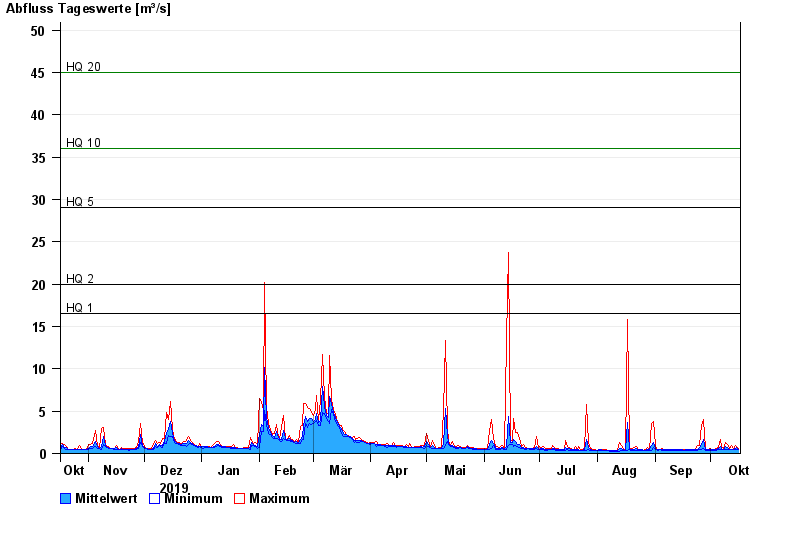
- HQ1 16,5 m³/s
- HQ2 20 m³/s
- HQ5 29 m³/s
- HQ10 36 m³/s
- HQ20 45 m³/s
- HQ50 60 m³/s
- HQ100 72 m³/s
| Date | Mean value [m³/s] | Maximum [m³/s] | Minimum [m³/s] |
|---|---|---|---|
| 16.10.2020 | 0.51 | 0.547 | 0.479 |
| 15.10.2020 | 0.683 | 0.867 | 0.513 |
| 14.10.2020 | 0.563 | 0.912 | 0.479 |
| 13.10.2020 | 0.497 | 0.512 | 0.479 |
| 12.10.2020 | 0.512 | 0.911 | 0.414 |
| 11.10.2020 | 0.491 | 0.582 | 0.446 |
| 10.10.2020 | 0.721 | 1.05 | 0.446 |
© Bayerisches Landesamt für Umwelt 2024