
- Start >
- Rivers >
- Discharge >
- Unterer Main >
- Goldbach >
- Chart of year

Chart of year Goldbach / Aschaff
Discharge from 30.03.2024 to 29.03.2025
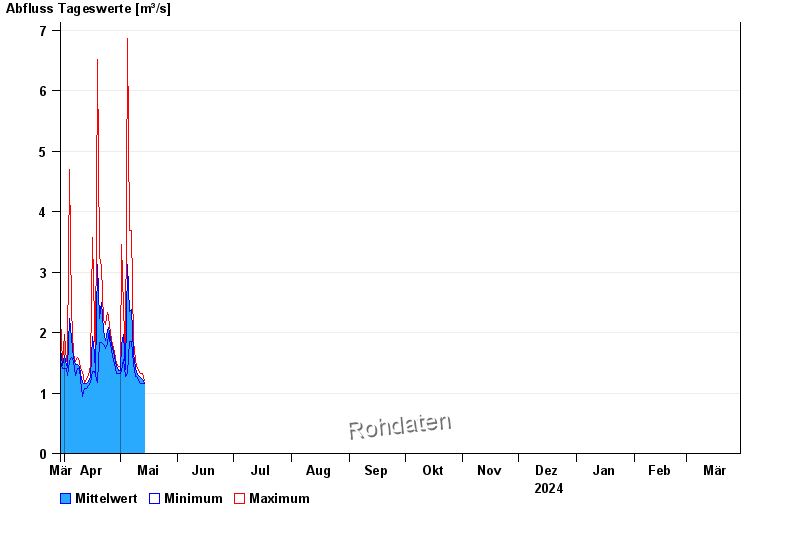
| Date | Mean value [m³/s] | Maximum [m³/s] | Minimum [m³/s] |
|---|---|---|---|
| 28.04.2024 | 1.53 | 1.58 | 1.46 |
| 27.04.2024 | 1.64 | 1.71 | 1.52 |
| 26.04.2024 | 1.81 | 1.9 | 1.71 |
| 25.04.2024 | 1.98 | 2.16 | 1.9 |
| 24.04.2024 | 1.93 | 2.23 | 1.71 |
| 23.04.2024 | 1.78 | 2.03 | 1.64 |
| 22.04.2024 | 1.94 | 2.09 | 1.71 |
© Bayerisches Landesamt für Umwelt 2024