
- Start >
- Rivers >
- Discharge >
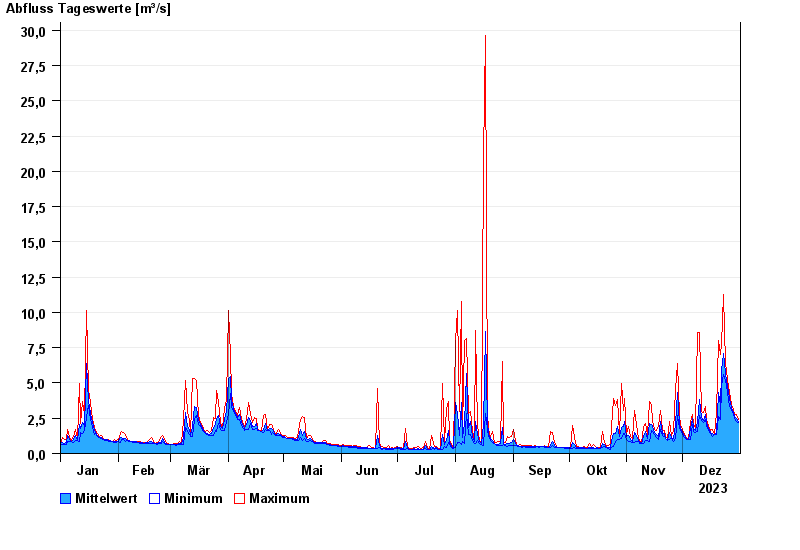
- Unterer Main >
- Goldbach >
- Chart of year

Chart of year Goldbach / Aschaff
Discharge from 01.01.2023 to 31.12.2023
| Date | Mean value [m³/s] | Maximum [m³/s] | Minimum [m³/s] |
|---|---|---|---|
| 31.12.2023 | 2.25 | 2.39 | 2.18 |
| 30.12.2023 | 2.48 | 2.74 | 2.25 |
| 29.12.2023 | 2.62 | 2.74 | 2.45 |
| 28.12.2023 | 2.93 | 3.11 | 2.73 |
| 27.12.2023 | 3.27 | 3.5 | 3.11 |
| 26.12.2023 | 3.92 | 4.34 | 3.34 |
| 25.12.2023 | 4.72 | 5.25 | 4.34 |
© Bayerisches Landesamt für Umwelt 2024