
- Start >
- Rivers >
- Discharge >
- Unterer Main >
- Ettleben >
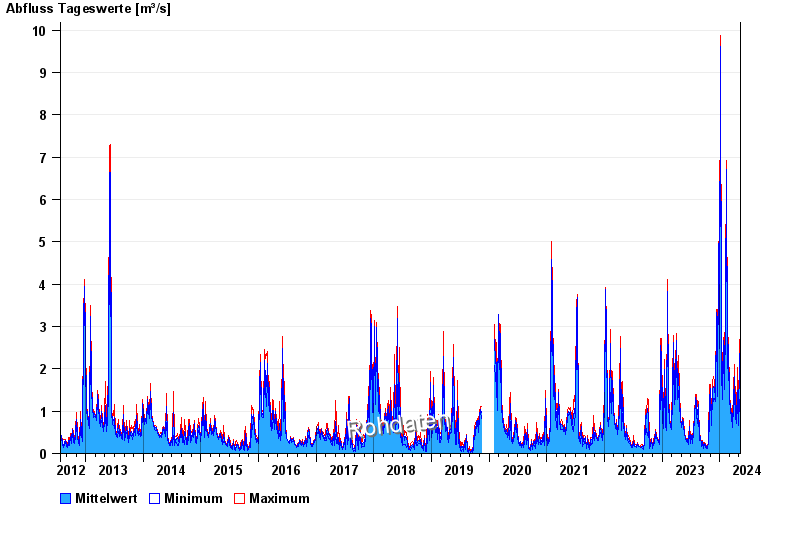
- Chart of total period

Chart of total period Ettleben / Wern
Discharge from 25.07.2012 to 10.05.2024
| Date | Mean value [m³/s] | Maximum [m³/s] | Minimum [m³/s] |
|---|---|---|---|
| 10.05.2024 | 0.569 | 0.573 | 0.553 |
| 09.05.2024 | 0.609 | 0.684 | 0.573 |
| 08.05.2024 | 0.76 | 0.859 | 0.661 |
| 07.05.2024 | 0.99 | 1.12 | 0.859 |
| 06.05.2024 | 0.936 | 1.09 | 0.886 |
| 05.05.2024 | 0.92 | 0.999 | 0.886 |
| 04.05.2024 | 1.34 | 2.03 | 0.999 |
© Bayerisches Landesamt für Umwelt 2024