
- Start >
- Rivers >
- Discharge >
- Unterer Main >
- Emskirchen >
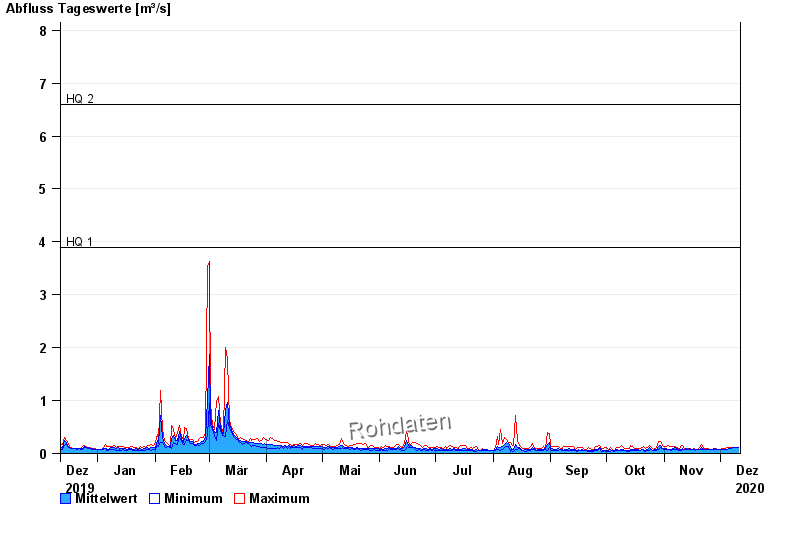
- Chart of year

Chart of year Emskirchen / Aurach
Discharge from 12.12.2019 to 11.12.2020
note
Wasserstand und Abfluss wird zeitweise durch Biberdamm beeinflusst.
- HQ1 3,9 m³/s
- HQ2 6,6 m³/s
- HQ5 9,2 m³/s
- HQ10 13,4 m³/s
- HQ20 18,7 m³/s
- HQ50 28,9 m³/s
- HQ100 39,6 m³/s
| Date | Mean value [m³/s] | Maximum [m³/s] | Minimum [m³/s] |
|---|---|---|---|
| 11.12.2020 | 0.115 | 0.122 | 0.111 |
| 10.12.2020 | 0.112 | 0.122 | 0.106 |
| 09.12.2020 | 0.106 | 0.106 | 0.106 |
| 08.12.2020 | 0.111 | 0.117 | 0.106 |
| 07.12.2020 | 0.093 | 0.111 | 0.086 |
| 06.12.2020 | 0.095 | 0.116 | 0.086 |
| 05.12.2020 | 0.082 | 0.111 | 0.081 |
© Bayerisches Landesamt für Umwelt 2024