
- Start >
- Rivers >
- Discharge >
- Unterer Main >
- Emskirchen >
- Chart of year

Chart of year Emskirchen / Aurach
Discharge from 06.07.2020 to 05.07.2021
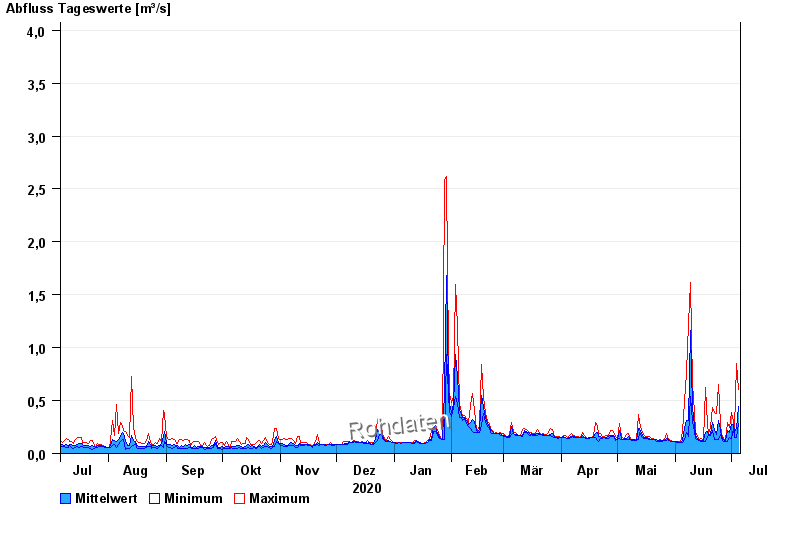
note
Wasserstand und Abfluss wird zeitweise durch Biberdamm beeinflusst.
- 21.12.1993 Abfluss: 27,7 m³/s
- 26.01.1995 Abfluss: 26,5 m³/s
- 21.03.2002 Abfluss: 26,2 m³/s
- 29.05.2007 Abfluss: 16,6 m³/s
- 02.03.1987 Abfluss: 15,4 m³/s
| Date | Mean value [m³/s] | Maximum [m³/s] | Minimum [m³/s] |
|---|---|---|---|
| 05.07.2021 | 0.44 | 0.601 | 0.282 |
| 04.07.2021 | 0.232 | 0.848 | 0.15 |
| 03.07.2021 | 0.194 | 0.234 | 0.15 |
| 02.07.2021 | 0.278 | 0.299 | 0.234 |
| 01.07.2021 | 0.27 | 0.384 | 0.144 |
| 30.06.2021 | 0.195 | 0.25 | 0.15 |
| 29.06.2021 | 0.22 | 0.29 | 0.116 |
© Bayerisches Landesamt für Umwelt 2024