
- Start >
- Rivers >
- Discharge >
- Unterer Main >
- Emskirchen >
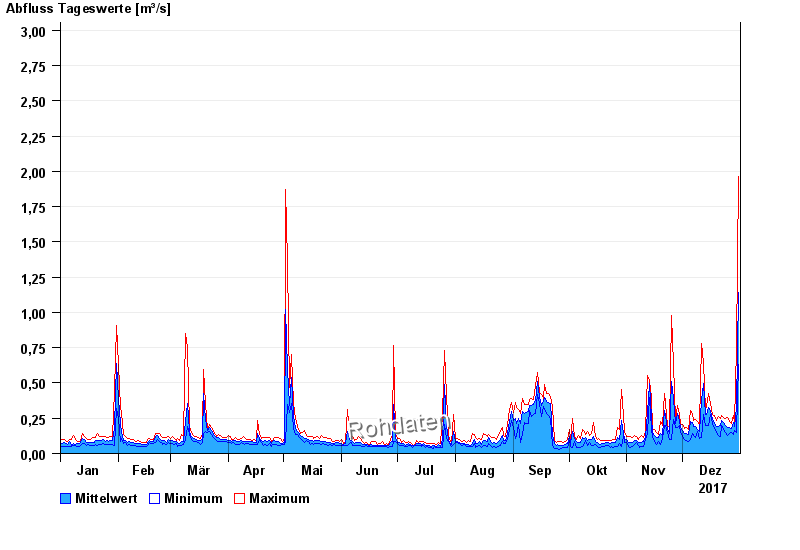
- Chart of year

Chart of year Emskirchen / Aurach
Discharge from 01.01.2017 to 31.12.2017
note
Wasserstand und Abfluss wird zeitweise durch Biberdamm beeinflusst.
- 21.12.1993 Abfluss: 27,7 m³/s
- 26.01.1995 Abfluss: 26,5 m³/s
- 21.03.2002 Abfluss: 26,2 m³/s
- 29.05.2007 Abfluss: 16,6 m³/s
- 02.03.1987 Abfluss: 15,4 m³/s
| Date | Mean value [m³/s] | Maximum [m³/s] | Minimum [m³/s] |
|---|---|---|---|
| 31.12.2017 | 1.14 | 1.96 | 0.631 |
| 30.12.2017 | 0.323 | 0.756 | 0.148 |
| 29.12.2017 | 0.192 | 0.215 | 0.162 |
| 28.12.2017 | 0.222 | 0.272 | 0.134 |
| 27.12.2017 | 0.18 | 0.214 | 0.15 |
| 26.12.2017 | 0.183 | 0.23 | 0.14 |
| 25.12.2017 | 0.185 | 0.254 | 0.127 |
© Bayerisches Landesamt für Umwelt 2024