
- Start >
- Rivers >
- Discharge >
- Unterer Main >
- Emskirchen >
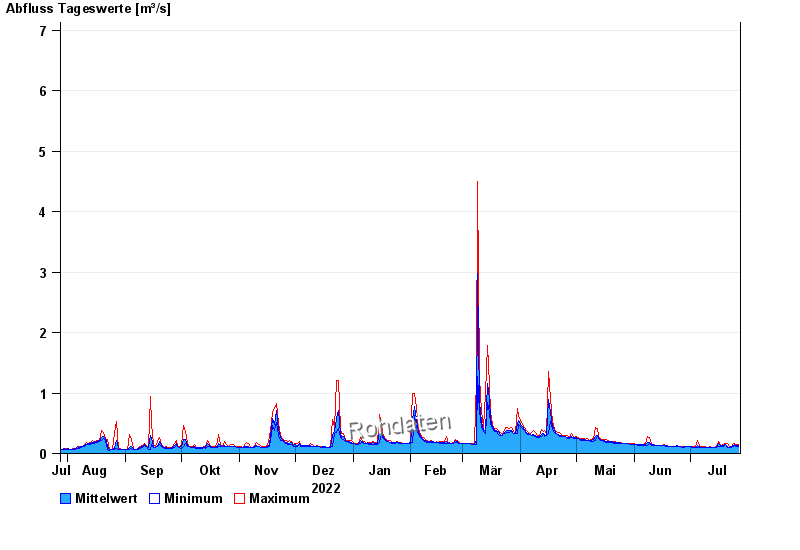
- Chart of year

Chart of year Emskirchen / Aurach
Discharge from 28.07.2022 to 27.07.2023
note
Wasserstand und Abfluss wird zeitweise durch Biberdamm beeinflusst.
- 21.12.1993 Abfluss: 27,7 m³/s
- 26.01.1995 Abfluss: 26,5 m³/s
- 21.03.2002 Abfluss: 26,2 m³/s
- 29.05.2007 Abfluss: 16,6 m³/s
- 02.03.1987 Abfluss: 15,4 m³/s
| Date | Mean value [m³/s] | Maximum [m³/s] | Minimum [m³/s] |
|---|---|---|---|
| 27.07.2023 | 0.13 | 0.146 | 0.122 |
| 26.07.2023 | 0.131 | 0.146 | 0.122 |
| 25.07.2023 | 0.142 | 0.158 | 0.134 |
| 24.07.2023 | 0.126 | 0.158 | 0.111 |
| 23.07.2023 | 0.11 | 0.111 | 0.101 |
| 22.07.2023 | 0.104 | 0.111 | 0.101 |
| 21.07.2023 | 0.115 | 0.171 | 0.091 |
© Bayerisches Landesamt für Umwelt 2024