
- Start >
- Rivers >
- Discharge >
- Unterer Main >
- Emskirchen >
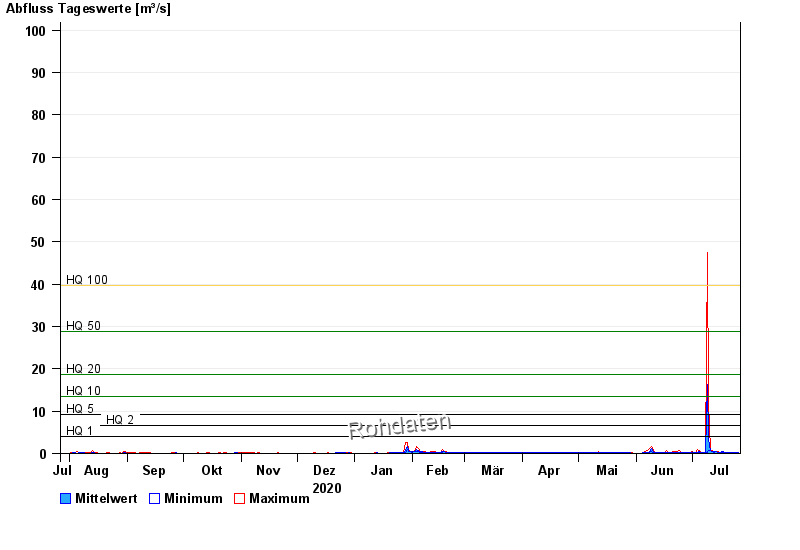
- Chart of year

Chart of year Emskirchen / Aurach
Discharge from 27.07.2020 to 26.07.2021
note
Wasserstand und Abfluss wird zeitweise durch Biberdamm beeinflusst.
- HQ1 3,9 m³/s
- HQ2 6,6 m³/s
- HQ5 9,2 m³/s
- HQ10 13,4 m³/s
- HQ20 18,7 m³/s
- HQ50 28,9 m³/s
- HQ100 39,6 m³/s
| Date | Mean value [m³/s] | Maximum [m³/s] | Minimum [m³/s] |
|---|---|---|---|
| 26.07.2021 | 0.196 | 0.243 | 0.17 |
| 25.07.2021 | 0.208 | 0.266 | 0.19 |
| 24.07.2021 | 0.185 | 0.205 | 0.17 |
| 23.07.2021 | 0.191 | 0.216 | 0.17 |
| 22.07.2021 | 0.197 | 0.212 | 0.183 |
| 21.07.2021 | 0.21 | 0.235 | 0.183 |
| 20.07.2021 | 0.226 | 0.242 | 0.205 |
© Bayerisches Landesamt für Umwelt 2024