
- Start >
- Rivers >
- Discharge >
- Unterer Main >
- Emskirchen >
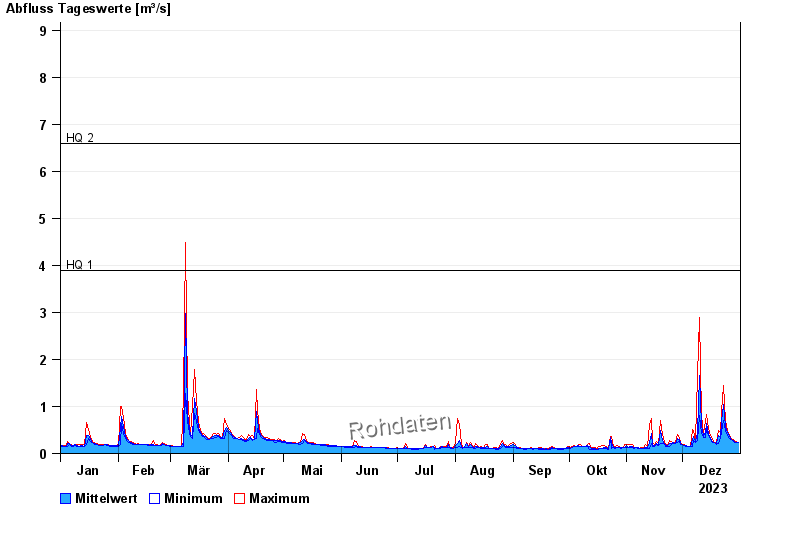
- Chart of year

Chart of year Emskirchen / Aurach
Discharge from 01.01.2023 to 31.12.2023
note
Wasserstand und Abfluss wird zeitweise durch Biberdamm beeinflusst.
- HQ1 3,9 m³/s
- HQ2 6,6 m³/s
- HQ5 9,2 m³/s
- HQ10 13,4 m³/s
- HQ20 18,7 m³/s
- HQ50 28,9 m³/s
- HQ100 39,6 m³/s
| Date | Mean value [m³/s] | Maximum [m³/s] | Minimum [m³/s] |
|---|---|---|---|
| 31.12.2023 | 0.23 | 0.241 | 0.225 |
| 30.12.2023 | 0.238 | 0.257 | 0.225 |
| 29.12.2023 | 0.256 | 0.273 | 0.241 |
| 28.12.2023 | 0.276 | 0.29 | 0.257 |
| 27.12.2023 | 0.303 | 0.323 | 0.29 |
| 26.12.2023 | 0.362 | 0.392 | 0.323 |
| 25.12.2023 | 0.443 | 0.498 | 0.392 |
© Bayerisches Landesamt für Umwelt 2024