
- Start >
- Rivers >
- Discharge >
- Unterer Main >
- Emskirchen >
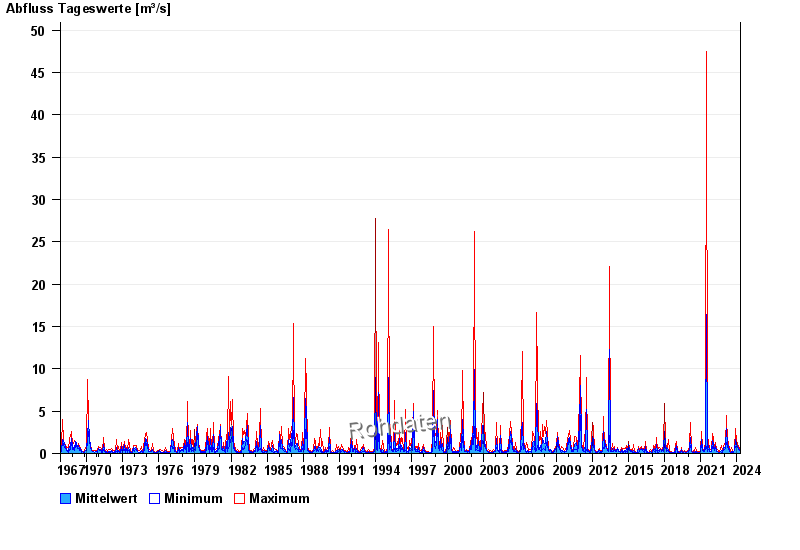
- Chart of total period

Chart of total period Emskirchen / Aurach
Discharge from 01.11.1967 to 26.04.2024
note
Wasserstand und Abfluss wird zeitweise durch Biberdamm beeinflusst.
| Date | Mean value [m³/s] | Maximum [m³/s] | Minimum [m³/s] |
|---|---|---|---|
| 26.04.2024 | 0.174 | 0.181 | 0.168 |
| 25.04.2024 | 0.183 | 0.196 | 0.168 |
| 24.04.2024 | 0.183 | 0.196 | 0.168 |
| 23.04.2024 | 0.209 | 0.225 | 0.196 |
| 22.04.2024 | 0.294 | 0.374 | 0.225 |
| 21.04.2024 | 0.221 | 0.357 | 0.181 |
| 20.04.2024 | 0.239 | 0.323 | 0.196 |
© Bayerisches Landesamt für Umwelt 2024