
- Start >
- Rivers >
- Discharge >
- Unterer Main >
- Bürgstadt >
- Chart of year

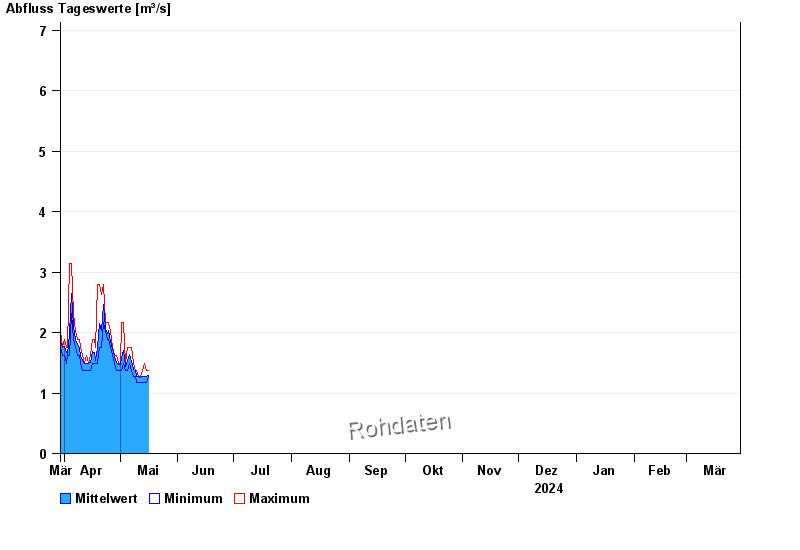
Chart of year Bürgstadt / Erf
Discharge from 30.03.2024 to 29.03.2025
- HQ1 22 m³/s
- HQ2 28 m³/s
- HQ5 42 m³/s
- HQ10 55 m³/s
- HQ20 67 m³/s
- HQ50 86 m³/s
- HQ100 100 m³/s
| Date | Mean value [m³/s] | Maximum [m³/s] | Minimum [m³/s] |
|---|---|---|---|
| 29.04.2024 | 1.58 | 1.62 | 1.49 |
| 28.04.2024 | 1.61 | 1.62 | 1.49 |
| 27.04.2024 | 1.74 | 1.75 | 1.62 |
| 26.04.2024 | 1.86 | 2.02 | 1.75 |
| 25.04.2024 | 2.04 | 2.17 | 1.88 |
| 24.04.2024 | 1.98 | 2.17 | 1.88 |
| 23.04.2024 | 2.07 | 2.17 | 2.02 |
© Bayerisches Landesamt für Umwelt 2024