
- Start >
- Rivers >
- Discharge >
- Unterer Main >
- Bürgstadt >
- Chart of year

Chart of year Bürgstadt / Erf
Discharge from 06.12.2020 to 05.12.2021
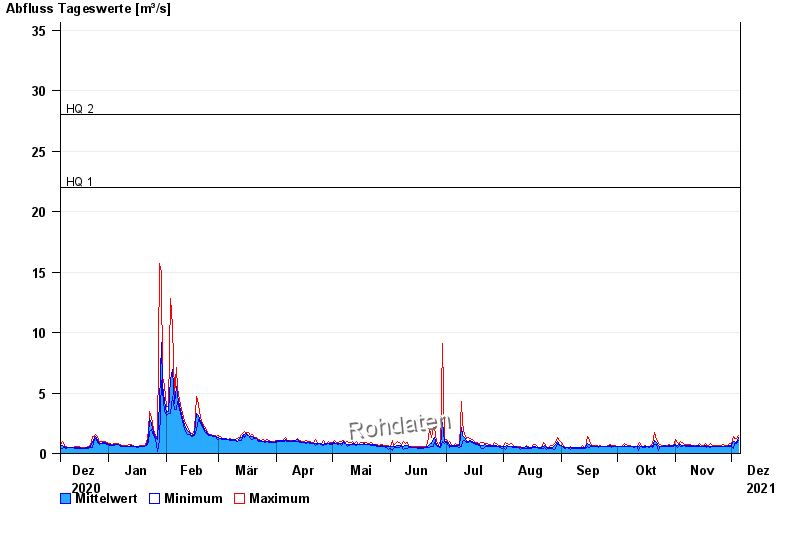
- HQ1 22 m³/s
- HQ2 28 m³/s
- HQ5 42 m³/s
- HQ10 55 m³/s
- HQ20 67 m³/s
- HQ50 86 m³/s
- HQ100 100 m³/s
| Date | Mean value [m³/s] | Maximum [m³/s] | Minimum [m³/s] |
|---|---|---|---|
| 05.12.2021 | 1.29 | 1.49 | 1.07 |
| 04.12.2021 | 0.888 | 1.27 | 0.794 |
| 03.12.2021 | 1.01 | 1.27 | 0.794 |
| 02.12.2021 | 0.967 | 1.38 | 0.425 |
| 01.12.2021 | 0.696 | 0.794 | 0.559 |
| 30.11.2021 | 0.649 | 0.794 | 0.559 |
| 29.11.2021 | 0.608 | 0.633 | 0.559 |
© Bayerisches Landesamt für Umwelt 2024