
- Start >
- Rivers >
- Discharge >
- Unterer Main >
- Bürgstadt >
- Chart of year

Chart of year Bürgstadt / Erf
Discharge from 01.12.2021 to 30.11.2022
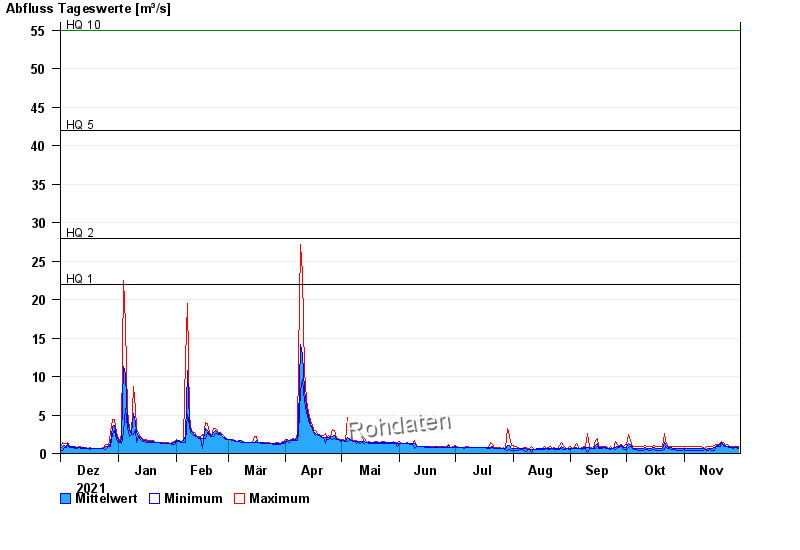
- HQ1 22 m³/s
- HQ2 28 m³/s
- HQ5 42 m³/s
- HQ10 55 m³/s
- HQ20 67 m³/s
- HQ50 86 m³/s
- HQ100 100 m³/s
| Date | Mean value [m³/s] | Maximum [m³/s] | Minimum [m³/s] |
|---|---|---|---|
| 30.11.2022 | 0.812 | 0.883 | 0.711 |
| 29.11.2022 | 0.883 | 0.97 | 0.794 |
| 28.11.2022 | 0.801 | 0.883 | 0.794 |
| 27.11.2022 | 0.8 | 0.883 | 0.711 |
| 26.11.2022 | 0.81 | 0.883 | 0.794 |
| 25.11.2022 | 0.879 | 0.97 | 0.794 |
| 24.11.2022 | 0.967 | 1.17 | 0.883 |
© Bayerisches Landesamt für Umwelt 2024