
- Start >
- Rivers >
- Discharge >
- Unterer Main >
- Bürgstadt >
- Chart of year

Chart of year Bürgstadt / Erf
Discharge from 01.01.2020 to 31.12.2020
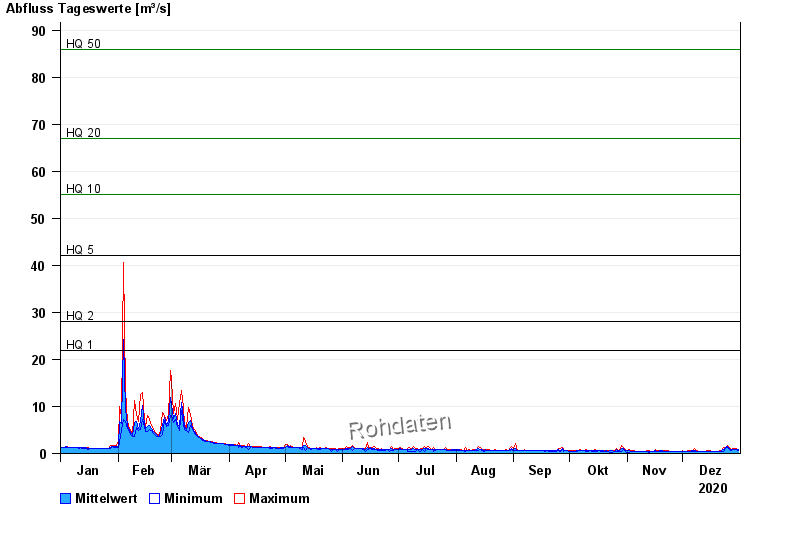
- HQ1 22 m³/s
- HQ2 28 m³/s
- HQ5 42 m³/s
- HQ10 55 m³/s
- HQ20 67 m³/s
- HQ50 86 m³/s
- HQ100 100 m³/s
| Date | Mean value [m³/s] | Maximum [m³/s] | Minimum [m³/s] |
|---|---|---|---|
| 31.12.2020 | 0.819 | 0.879 | 0.716 |
| 30.12.2020 | 0.889 | 0.968 | 0.799 |
| 29.12.2020 | 0.886 | 0.968 | 0.799 |
| 28.12.2020 | 0.83 | 0.968 | 0.799 |
| 27.12.2020 | 0.8 | 0.879 | 0.716 |
| 26.12.2020 | 1.05 | 1.37 | 0.879 |
| 25.12.2020 | 1.42 | 1.6 | 1.26 |
© Bayerisches Landesamt für Umwelt 2024