
- Start >
- Rivers >
- Discharge >
- Unterer Main >
- Bruckberg >
- Chart of year

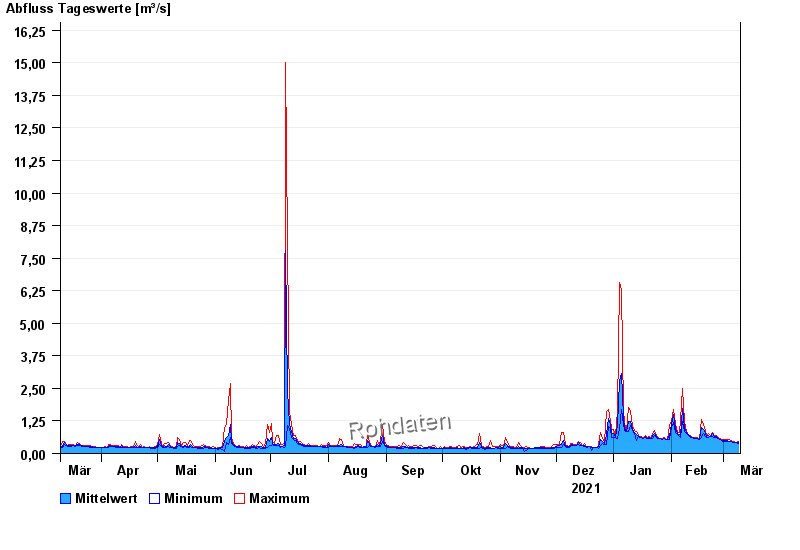
Chart of year Bruckberg / Haselbach
Discharge from 10.03.2021 to 09.03.2022
| Date | Mean value [m³/s] | Maximum [m³/s] | Minimum [m³/s] |
|---|---|---|---|
| 09.03.2022 | 0.411 | 0.445 | 0.38 |
| 08.03.2022 | 0.412 | 0.412 | 0.412 |
| 07.03.2022 | 0.419 | 0.445 | 0.412 |
| 06.03.2022 | 0.418 | 0.445 | 0.412 |
| 05.03.2022 | 0.474 | 0.503 | 0.467 |
| 04.03.2022 | 0.476 | 0.54 | 0.467 |
| 03.03.2022 | 0.487 | 0.54 | 0.467 |
© Bayerisches Landesamt für Umwelt 2024