
- Start >
- Rivers >
- Discharge >
- Unterer Main >
- Bruckberg >
- Chart of year

Chart of year Bruckberg / Haselbach
Discharge from 26.04.2024 to 25.04.2025
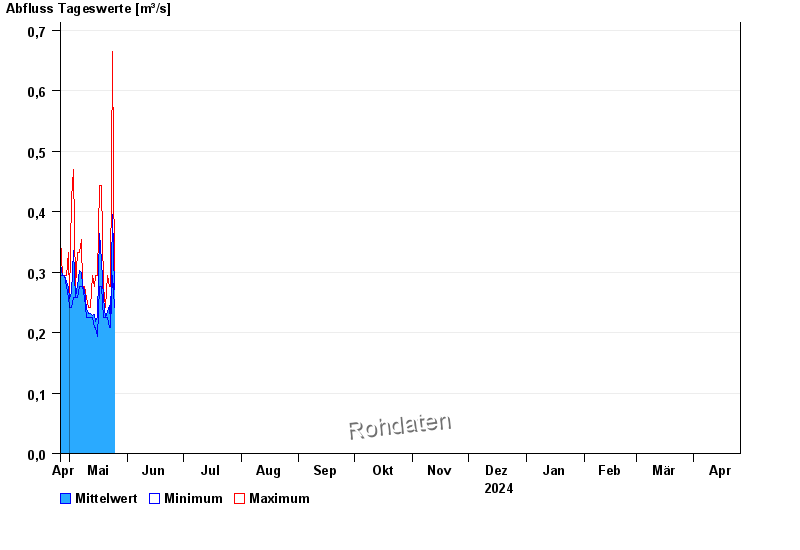
| Date | Mean value [m³/s] | Maximum [m³/s] | Minimum [m³/s] |
|---|---|---|---|
| 23.05.2024 | 0.212 | 0.276 | 0.209 |
| 22.05.2024 | 0.245 | 0.276 | 0.209 |
| 21.05.2024 | 0.235 | 0.294 | 0.225 |
| 20.05.2024 | 0.225 | 0.241 | 0.225 |
| 19.05.2024 | 0.256 | 0.276 | 0.225 |
| 18.05.2024 | 0.319 | 0.444 | 0.276 |
| 17.05.2024 | 0.364 | 0.444 | 0.276 |
© Bayerisches Landesamt für Umwelt 2024