
- Start >
- Rivers >
- Discharge >
- Unterer Main >
- Bruckberg >
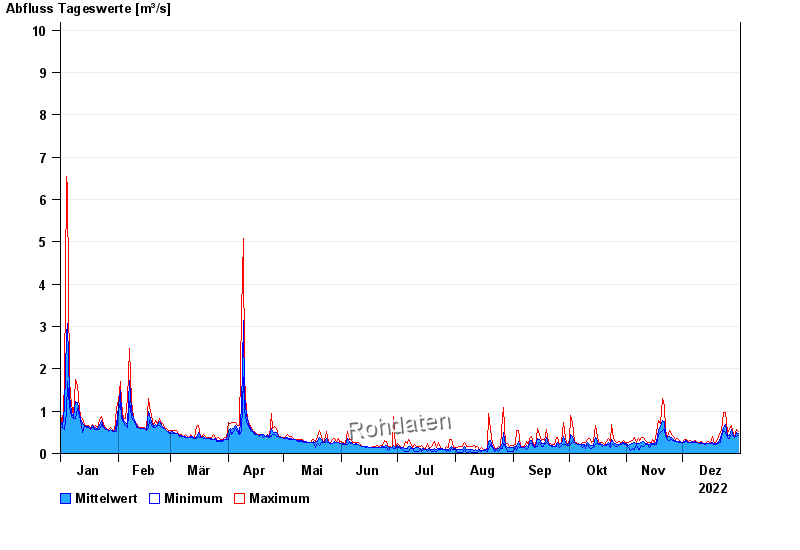
- Chart of year

Chart of year Bruckberg / Haselbach
Discharge from 01.01.2022 to 31.12.2022
- 08.01.2011 Abfluss: 14,3 m³/s
- 22.01.2012 Abfluss: 13,9 m³/s
- 21.12.1993 Abfluss: 12,7 m³/s
- 13.01.2011 Abfluss: 12,1 m³/s
- 13.04.1994 Abfluss: 12 m³/s
| Date | Mean value [m³/s] | Maximum [m³/s] | Minimum [m³/s] |
|---|---|---|---|
| 31.12.2022 | 0.475 | 0.512 | 0.436 |
| 30.12.2022 | 0.485 | 0.566 | 0.412 |
| 29.12.2022 | 0.382 | 0.39 | 0.368 |
| 28.12.2022 | 0.415 | 0.46 | 0.39 |
| 27.12.2022 | 0.557 | 0.653 | 0.46 |
| 26.12.2022 | 0.432 | 0.566 | 0.347 |
| 25.12.2022 | 0.417 | 0.486 | 0.368 |
© Bayerisches Landesamt für Umwelt 2024