
- Start >
- Rivers >
- Discharge >
- Unterer Main >
- Bruckberg >
- Chart of year

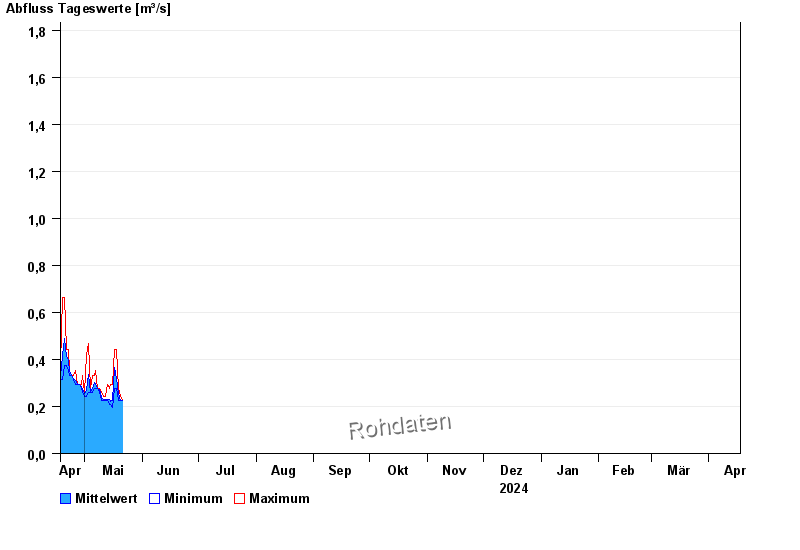
Chart of year Bruckberg / Haselbach
Discharge from 18.04.2024 to 17.04.2025
- HQ5 13 m³/s
- HQ10 17,2 m³/s
- HQ20 22 m³/s
- HQ50 30,3 m³/s
- HQ100 37,9 m³/s
| Date | Mean value [m³/s] | Maximum [m³/s] | Minimum [m³/s] |
|---|---|---|---|
| 30.04.2024 | 0.275 | 0.294 | 0.258 |
| 29.04.2024 | 0.285 | 0.294 | 0.276 |
| 28.04.2024 | 0.294 | 0.294 | 0.294 |
| 27.04.2024 | 0.294 | 0.294 | 0.294 |
| 26.04.2024 | 0.312 | 0.354 | 0.294 |
| 25.04.2024 | 0.317 | 0.333 | 0.313 |
| 24.04.2024 | 0.333 | 0.333 | 0.333 |
© Bayerisches Landesamt für Umwelt 2024