
- Start >
- Rivers >
- Discharge >
- Unterer Main >
- Bockenfeld >
- Chart of year

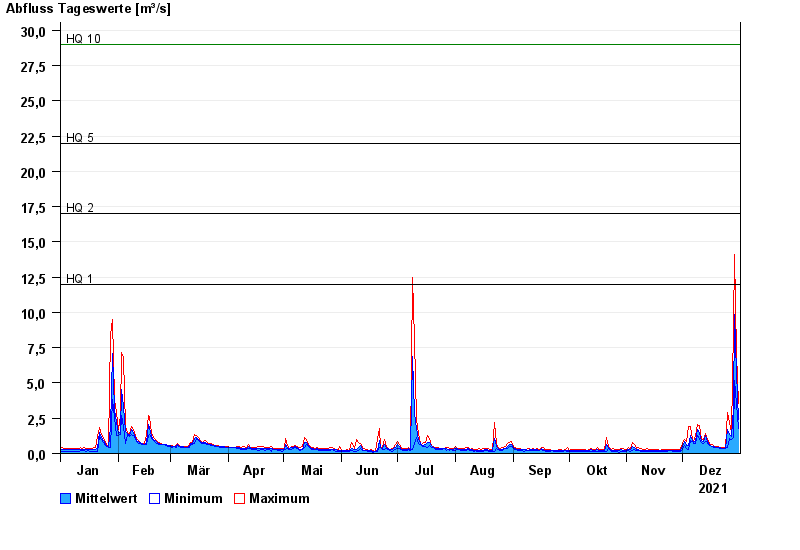
Chart of year Bockenfeld / Tauber
Discharge from 01.01.2021 to 31.12.2021
note
Wasserstand und Abfluss wird zeitweise durch Biberdamm beeinflusst.
- HQ1 12 m³/s
- HQ2 17 m³/s
- HQ5 22 m³/s
- HQ10 29 m³/s
- HQ20 35 m³/s
- HQ50 44 m³/s
- HQ100 54 m³/s
| Date | Mean value [m³/s] | Maximum [m³/s] | Minimum [m³/s] |
|---|---|---|---|
| 31.12.2021 | 2.39 | 3.54 | 1.75 |
| 30.12.2021 | 5.72 | 7.07 | 3.54 |
| 29.12.2021 | 9.86 | 14.1 | 5.18 |
| 28.12.2021 | 3.25 | 9.01 | 1.16 |
| 27.12.2021 | 1.21 | 1.5 | 0.982 |
| 26.12.2021 | 1.37 | 2.18 | 1.04 |
| 25.12.2021 | 1.67 | 2.9 | 0.435 |
© Bayerisches Landesamt für Umwelt 2024