
- Start >
- Rivers >
- Discharge >
- Unterer Main >
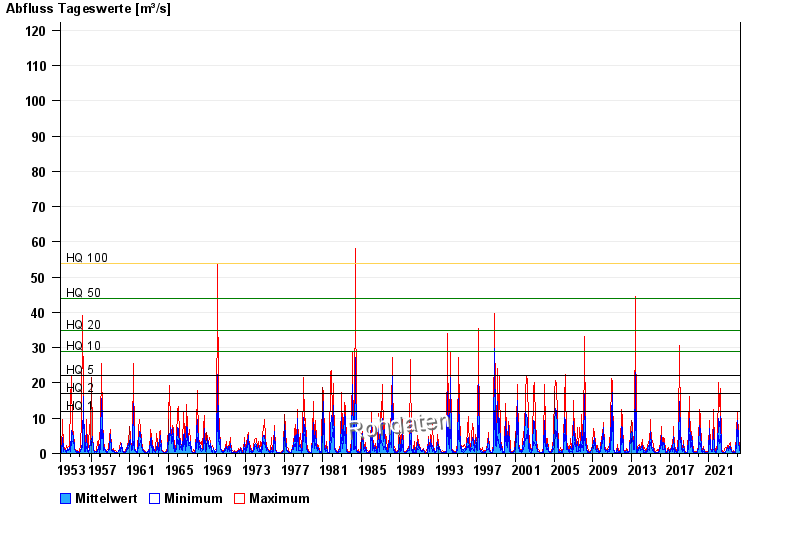
- Bockenfeld >
- Chart of total period

Chart of total period Bockenfeld / Tauber
Discharge from 01.11.1953 to 26.04.2024
note
Wasserstand und Abfluss wird zeitweise durch Biberdamm beeinflusst.
- HQ1 12 m³/s
- HQ2 17 m³/s
- HQ5 22 m³/s
- HQ10 29 m³/s
- HQ20 35 m³/s
- HQ50 44 m³/s
- HQ100 54 m³/s
| Date | Mean value [m³/s] | Maximum [m³/s] | Minimum [m³/s] |
|---|---|---|---|
| 26.04.2024 | 0.523 | 0.545 | 0.519 |
| 25.04.2024 | 0.564 | 0.623 | 0.47 |
| 24.04.2024 | 0.563 | 0.649 | 0.446 |
| 23.04.2024 | 0.62 | 0.675 | 0.424 |
| 22.04.2024 | 0.778 | 0.865 | 0.675 |
| 21.04.2024 | 0.761 | 0.891 | 0.649 |
| 20.04.2024 | 0.832 | 1 | 0.701 |
© Bayerisches Landesamt für Umwelt 2024