
- Start >
- Rivers >
- Discharge >
- Unterer Main >
- Bischbrunn >
- Chart of total period

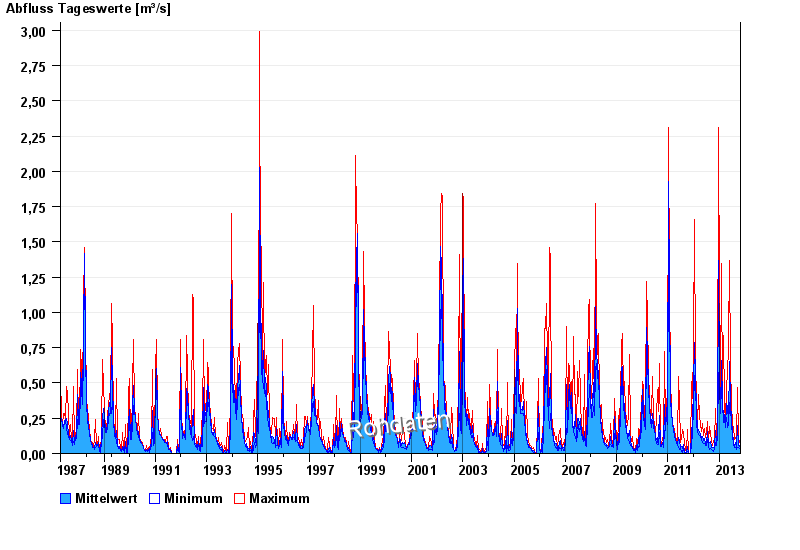
Chart of total period Bischbrunn / Metzenbach
Discharge from 20.04.1987 to 31.10.2013
- Niedrigwasserabfluss NQ m³/s
- Mittlerer Niedrigwasserabfluss MNQ m³/s
- Mittlerer Abfluss MQ m³/s
- Mittlerer Hochwasserabfluss MHQ m³/s
- Hochwasserabfluss HQ m³/s
| Date | Mean value [m³/s] | Maximum [m³/s] | Minimum [m³/s] |
|---|---|---|---|
| 31.10.2013 | 0.01 | 0.01 | 0.009 |
| 30.10.2013 | 0.01 | 0.01 | 0.01 |
| 29.10.2013 | 0.016 | 0.025 | 0.01 |
| 28.10.2013 | 0.034 | 0.042 | 0.023 |
| 27.10.2013 | 0.038 | 0.053 | 0.007 |
| 26.10.2013 | 0.009 | 0.01 | 0.007 |
| 25.10.2013 | 0.009 | 0.01 | 0.009 |
© Bayerisches Landesamt für Umwelt 2026