
- Start >
- Rivers >
- Discharge >
- Unterer Main >
- Birkenfeld >
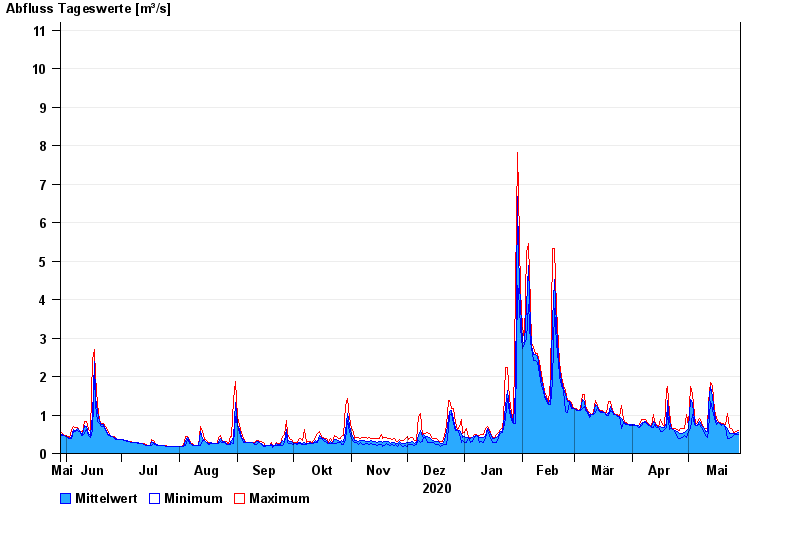
- Chart of year

Chart of year Birkenfeld / Aisch
Discharge from 29.05.2020 to 28.05.2021
- 09.07.2021 Abfluss: 83,7 m³/s
- 24.05.1978 Abfluss: 60 m³/s
- 30.10.1998 Abfluss: 45,1 m³/s
- 21.03.2002 Abfluss: 43,2 m³/s
- 08.01.2011 Abfluss: 39,3 m³/s
| Date | Mean value [m³/s] | Maximum [m³/s] | Minimum [m³/s] |
|---|---|---|---|
| 28.05.2021 | 0.544 | 0.604 | 0.504 |
| 27.05.2021 | 0.523 | 0.57 | 0.504 |
| 26.05.2021 | 0.521 | 0.537 | 0.504 |
| 25.05.2021 | 0.51 | 0.55 | 0.473 |
| 24.05.2021 | 0.52 | 0.662 | 0.413 |
| 23.05.2021 | 0.527 | 0.677 | 0.385 |
| 22.05.2021 | 0.648 | 1.05 | 0.385 |
© Bayerisches Landesamt für Umwelt 2024