
- Start >
- Rivers >
- Discharge >
- Unterer Main >
- Birkenfeld >
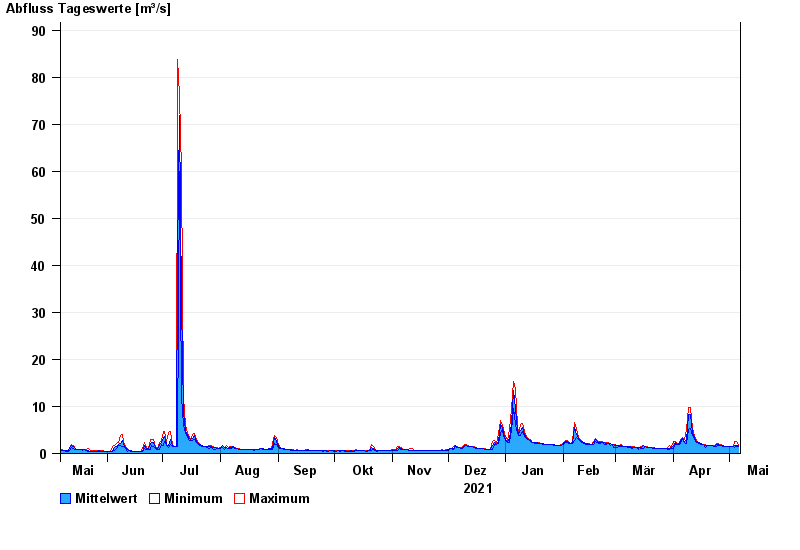
- Chart of year

Chart of year Birkenfeld / Aisch
Discharge from 07.05.2021 to 06.05.2022
| Date | Mean value [m³/s] | Maximum [m³/s] | Minimum [m³/s] |
|---|---|---|---|
| 06.05.2022 | 1.72 | 1.86 | 1.52 |
| 05.05.2022 | 1.78 | 2.52 | 1.46 |
| 04.05.2022 | 1.69 | 2.52 | 1.35 |
| 03.05.2022 | 1.43 | 1.46 | 1.4 |
| 02.05.2022 | 1.42 | 1.46 | 1.4 |
| 01.05.2022 | 1.51 | 1.51 | 1.4 |
| 30.04.2022 | 1.51 | 1.51 | 1.51 |
© Bayerisches Landesamt für Umwelt 2024