
- Start >
- Rivers >
- Discharge >
- Unterer Main >
- Birkenfeld >
- Chart of year

Chart of year Birkenfeld / Aisch
Discharge from 01.12.2020 to 30.11.2021
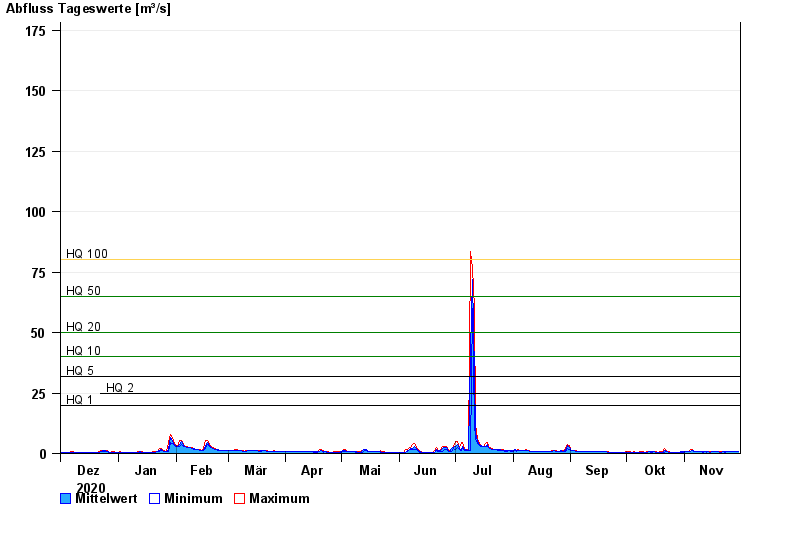
- HQ1 20 m³/s
- HQ2 25 m³/s
- HQ5 32 m³/s
- HQ10 40 m³/s
- HQ20 50 m³/s
- HQ50 65 m³/s
- HQ100 80 m³/s
| Date | Mean value [m³/s] | Maximum [m³/s] | Minimum [m³/s] |
|---|---|---|---|
| 30.11.2021 | 0.738 | 0.846 | 0.652 |
| 29.11.2021 | 0.675 | 0.728 | 0.652 |
| 28.11.2021 | 0.721 | 0.848 | 0.653 |
| 27.11.2021 | 0.704 | 0.729 | 0.653 |
| 26.11.2021 | 0.672 | 0.729 | 0.654 |
| 25.11.2021 | 0.669 | 0.692 | 0.655 |
| 24.11.2021 | 0.702 | 0.731 | 0.692 |
© Bayerisches Landesamt für Umwelt 2024