
- Start >
- Rivers >
- Discharge >
- Unterer Main >
- Birkenfeld >
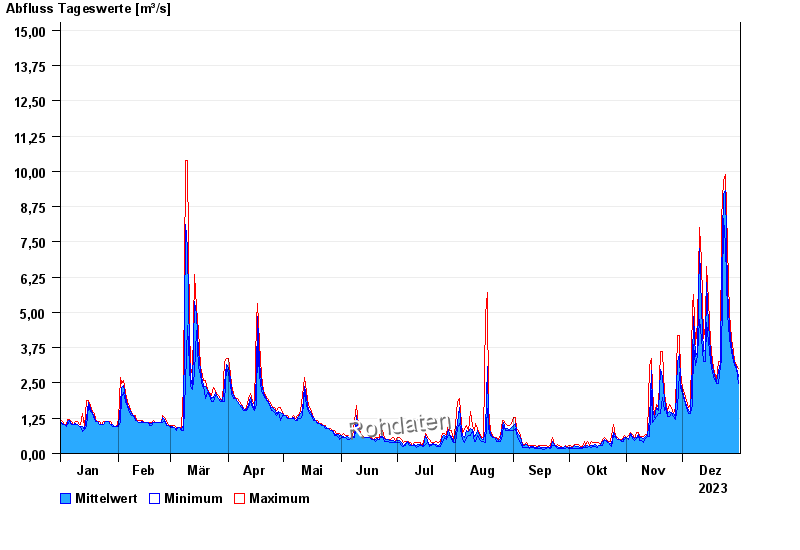
- Chart of year

Chart of year Birkenfeld / Aisch
Discharge from 01.01.2023 to 31.12.2023
- 09.07.2021 Abfluss: 83,7 m³/s
- 24.05.1978 Abfluss: 60 m³/s
- 30.10.1998 Abfluss: 45,1 m³/s
- 21.03.2002 Abfluss: 43,2 m³/s
- 08.01.2011 Abfluss: 39,3 m³/s
| Date | Mean value [m³/s] | Maximum [m³/s] | Minimum [m³/s] |
|---|---|---|---|
| 31.12.2023 | 2.72 | 3 | 2.48 |
| 30.12.2023 | 3.06 | 3.12 | 3 |
| 29.12.2023 | 3.18 | 3.25 | 3.12 |
| 28.12.2023 | 3.4 | 3.61 | 3.25 |
| 27.12.2023 | 3.78 | 4.08 | 3.61 |
| 26.12.2023 | 4.46 | 4.95 | 4.08 |
| 25.12.2023 | 5.8 | 7.32 | 4.95 |
© Bayerisches Landesamt für Umwelt 2024