
- Start >
- Rivers >
- Discharge >
- Unterer Main >
- Birkenfeld >
- Chart of year

Chart of year Birkenfeld / Aisch
Discharge from 20.01.2022 to 19.01.2023
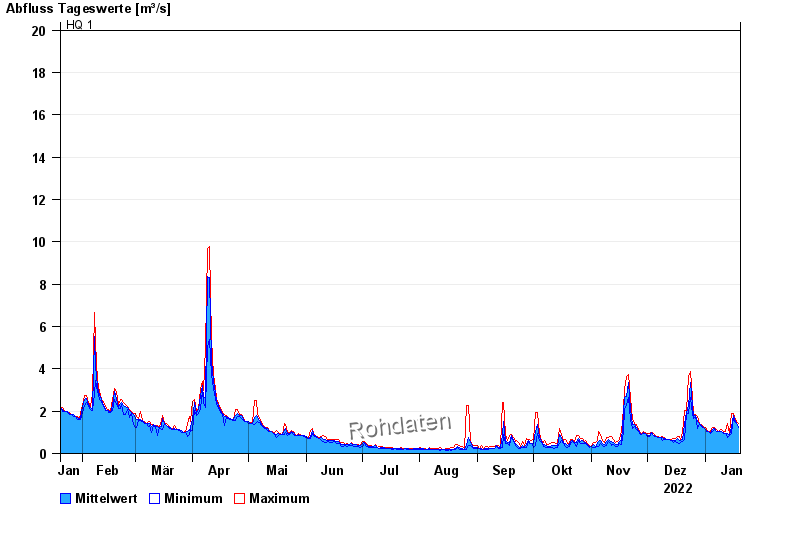
- HQ1 20 m³/s
- HQ2 25 m³/s
- HQ5 32 m³/s
- HQ10 40 m³/s
- HQ20 50 m³/s
- HQ50 65 m³/s
- HQ100 80 m³/s
| Date | Mean value [m³/s] | Maximum [m³/s] | Minimum [m³/s] |
|---|---|---|---|
| 19.01.2023 | 1.28 | 1.4 | 1.21 |
| 18.01.2023 | 1.41 | 1.49 | 1.4 |
| 17.01.2023 | 1.6 | 1.69 | 1.49 |
| 16.01.2023 | 1.8 | 1.89 | 1.69 |
| 15.01.2023 | 1.29 | 1.89 | 0.946 |
| 14.01.2023 | 0.866 | 0.946 | 0.858 |
| 13.01.2023 | 0.948 | 1.4 | 0.779 |
© Bayerisches Landesamt für Umwelt 2024