
- Start >
- Rivers >
- Discharge >
- Unterer Main >
- Bieberehren >
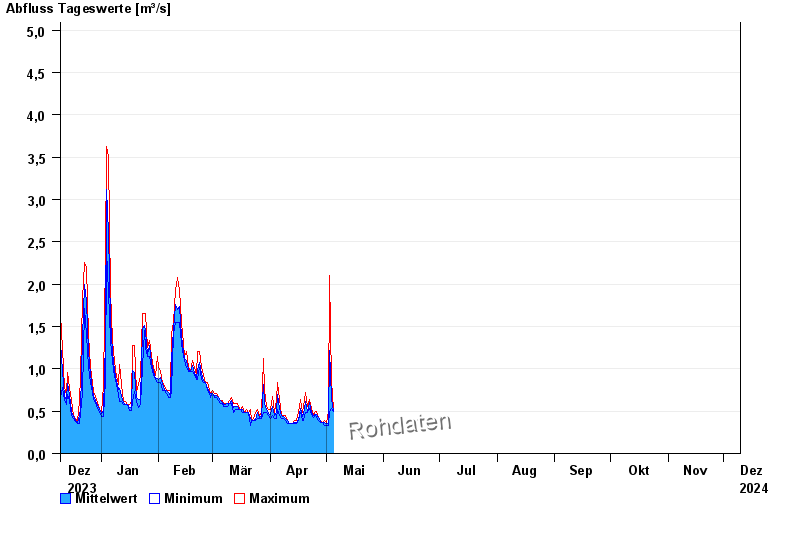
- Chart of year

Chart of year Bieberehren / Gollach
Discharge from 10.12.2023 to 09.12.2024
- 01.06.2013 Abfluss: 36,8 m³/s
- 26.01.1995 Abfluss: 23,4 m³/s
- 10.06.1965 Abfluss: 23 m³/s
- 22.02.1970 Abfluss: 22,2 m³/s
- 31.01.1982 Abfluss: 20,4 m³/s
| Date | Mean value [m³/s] | Maximum [m³/s] | Minimum [m³/s] |
|---|---|---|---|
| 27.07.2024 | 0.186 | 0.198 | 0.178 |
| 26.07.2024 | 0.205 | 0.219 | 0.198 |
| 25.07.2024 | 0.224 | 0.241 | 0.198 |
| 24.07.2024 | 0.258 | 0.318 | 0.219 |
| 23.07.2024 | 0.223 | 0.241 | 0.198 |
| 22.07.2024 | 0.247 | 0.291 | 0.241 |
| 21.07.2024 | 0.236 | 0.318 | 0.219 |
© Bayerisches Landesamt für Umwelt 2024