
- Start >
- Rivers >
- Discharge >
- Unterer Main >
- Bieberehren >
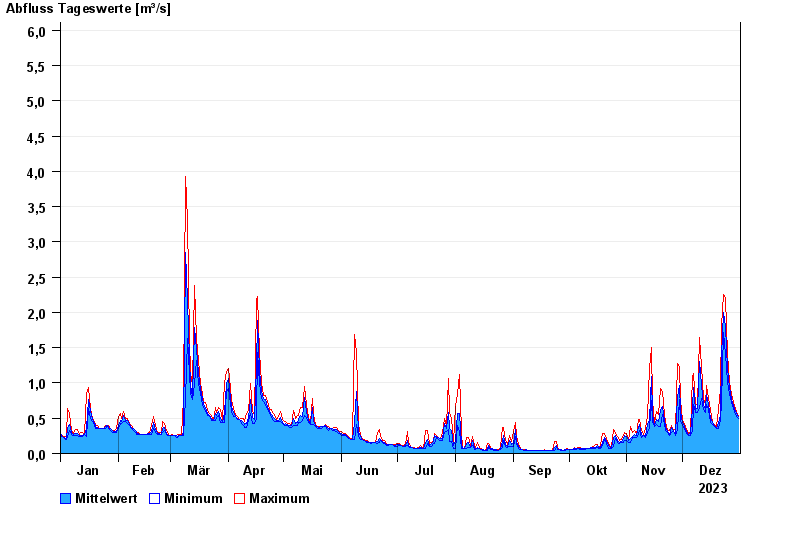
- Chart of year

Chart of year Bieberehren / Gollach
Discharge from 01.01.2023 to 31.12.2023
- 01.06.2013 Abfluss: 36,8 m³/s
- 26.01.1995 Abfluss: 23,4 m³/s
- 10.06.1965 Abfluss: 23 m³/s
- 22.02.1970 Abfluss: 22,2 m³/s
- 31.01.1982 Abfluss: 20,4 m³/s
| Date | Mean value [m³/s] | Maximum [m³/s] | Minimum [m³/s] |
|---|---|---|---|
| 31.12.2023 | 0.522 | 0.528 | 0.493 |
| 30.12.2023 | 0.569 | 0.601 | 0.527 |
| 29.12.2023 | 0.627 | 0.678 | 0.6 |
| 28.12.2023 | 0.678 | 0.717 | 0.638 |
| 27.12.2023 | 0.76 | 0.842 | 0.716 |
| 26.12.2023 | 0.931 | 1.02 | 0.842 |
| 25.12.2023 | 1.21 | 1.41 | 1.02 |
© Bayerisches Landesamt für Umwelt 2024