
- Start >
- Rivers >
- Discharge >
- Unterer Main >
- Bad Königshofen im Grabfeld >
- Chart of year

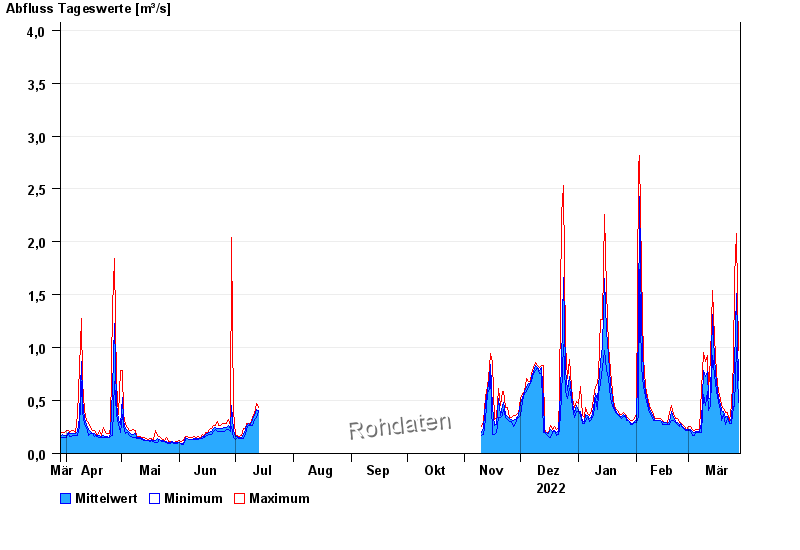
Chart of year Bad Königshofen im Grabfeld / Fränkische Saale
Discharge from 29.03.2022 to 28.03.2023
note
Biberaktivität: Werte können durch Aufstau beeinflusst sein
- 07.05.1969 Abfluss: 20,9 m³/s
- 03.01.2003 Abfluss: 19,3 m³/s
- 24.12.1968 Abfluss: 16,6 m³/s
- 08.01.2011 Abfluss: 15,2 m³/s
- 23.02.1970 Abfluss: 15,1 m³/s
| Date | Mean value [m³/s] | Maximum [m³/s] | Minimum [m³/s] |
|---|---|---|---|
| 28.03.2023 | 0.692 | 0.973 | 0.484 |
| 27.03.2023 | 1.51 | 2.08 | 1 |
| 26.03.2023 | 0.839 | 1.66 | 0.44 |
| 25.03.2023 | 0.651 | 0.86 | 0.44 |
| 24.03.2023 | 0.335 | 0.462 | 0.283 |
| 23.03.2023 | 0.293 | 0.301 | 0.283 |
| 22.03.2023 | 0.347 | 0.387 | 0.329 |
© Bayerisches Landesamt für Umwelt 2024