
- Start >
- Rivers >
- Discharge >
- Unterer Main >
- Bad Königshofen im Grabfeld >
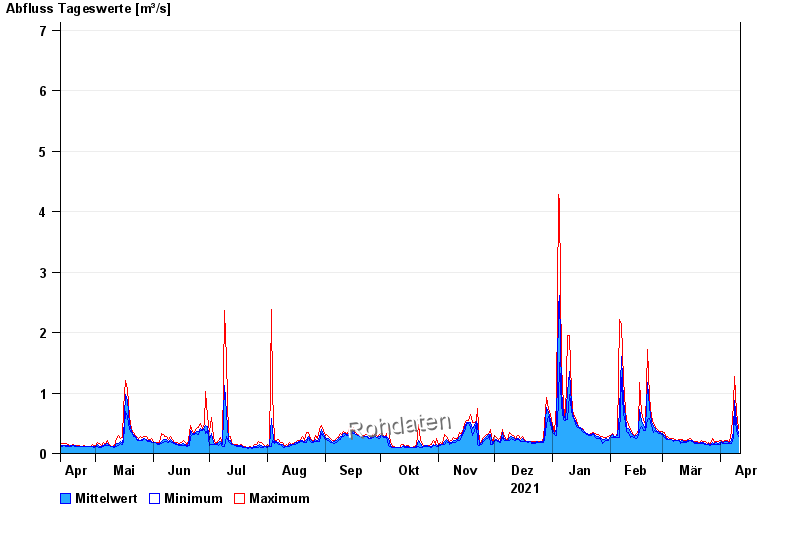
- Chart of year

Chart of year Bad Königshofen im Grabfeld / Fränkische Saale
Discharge from 12.04.2021 to 11.04.2022
note
Biberaktivität: Werte können durch Aufstau beeinflusst sein
- 07.05.1969 Abfluss: 20,9 m³/s
- 03.01.2003 Abfluss: 19,3 m³/s
- 24.12.1968 Abfluss: 16,6 m³/s
- 08.01.2011 Abfluss: 15,2 m³/s
- 23.02.1970 Abfluss: 15,1 m³/s
| Date | Mean value [m³/s] | Maximum [m³/s] | Minimum [m³/s] |
|---|---|---|---|
| 11.04.2022 | 0.335 | 0.407 | 0.275 |
| 10.04.2022 | 0.509 | 0.684 | 0.387 |
| 09.04.2022 | 0.873 | 1.28 | 0.684 |
| 08.04.2022 | 0.342 | 0.814 | 0.259 |
| 07.04.2022 | 0.212 | 0.367 | 0.173 |
| 06.04.2022 | 0.185 | 0.199 | 0.173 |
| 05.04.2022 | 0.192 | 0.213 | 0.173 |
© Bayerisches Landesamt für Umwelt 2024