
- Start >
- Rivers >
- Discharge >
- Unterer Main >
- Bad Königshofen im Grabfeld >
- Chart of year

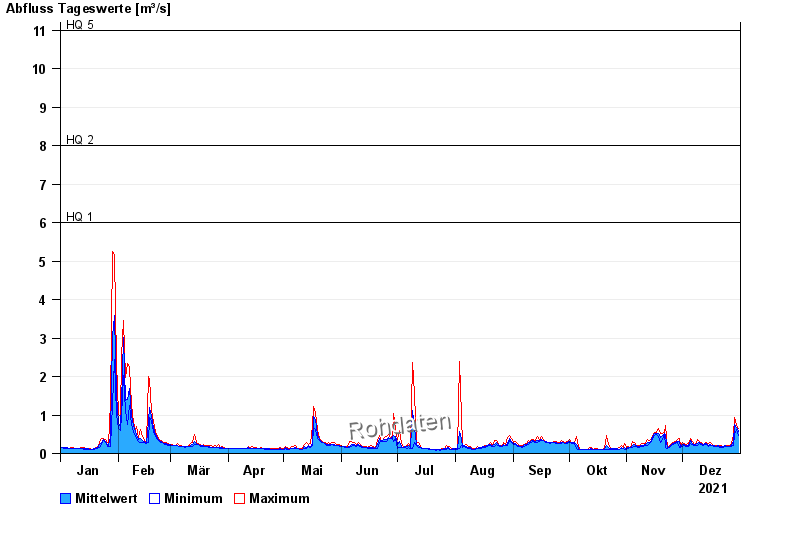
Chart of year Bad Königshofen im Grabfeld / Fränkische Saale
Discharge from 01.01.2021 to 31.12.2021
note
Biberaktivität: Werte können durch Aufstau beeinflusst sein
- HQ1 6 m³/s
- HQ2 8 m³/s
- HQ5 11 m³/s
- HQ10 14 m³/s
- HQ20 16 m³/s
- HQ50 18 m³/s
- HQ100 22 m³/s
| Date | Mean value [m³/s] | Maximum [m³/s] | Minimum [m³/s] |
|---|---|---|---|
| 31.12.2021 | 0.564 | 0.638 | 0.476 |
| 30.12.2021 | 0.675 | 0.74 | 0.614 |
| 29.12.2021 | 0.753 | 0.927 | 0.498 |
| 28.12.2021 | 0.32 | 0.498 | 0.219 |
| 27.12.2021 | 0.202 | 0.249 | 0.179 |
| 26.12.2021 | 0.194 | 0.206 | 0.179 |
| 25.12.2021 | 0.19 | 0.206 | 0.179 |
© Bayerisches Landesamt für Umwelt 2024