
- Start >
- Rivers >
- Discharge >
- Unterer Main >
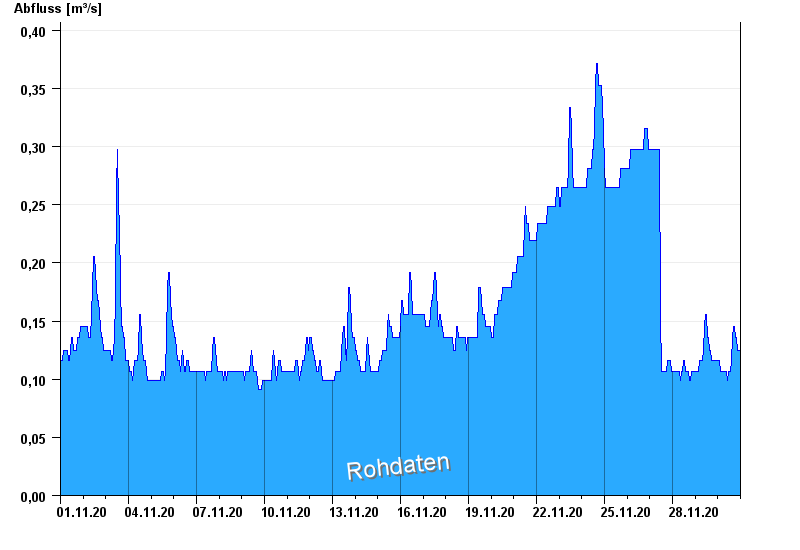
- Bad Königshofen im Grabfeld >
- Chart of month

Chart of month Bad Königshofen im Grabfeld / Fränkische Saale
Discharge from 01.11.2020 to 30.11.2020
note
Biberaktivität: Werte können durch Aufstau beeinflusst sein
- HQ1 6 m³/s
- HQ2 8 m³/s
- HQ5 11 m³/s
- HQ10 14 m³/s
- HQ20 16 m³/s
- HQ50 18 m³/s
- HQ100 22 m³/s
| Date | Runoff [m³/s] |
|---|---|
| 30.11.2020 23:45 | 0.116 |
| 30.11.2020 23:30 | 0.125 |
| 30.11.2020 23:15 | 0.125 |
| 30.11.2020 23:00 | 0.125 |
| 30.11.2020 22:45 | 0.125 |
| 30.11.2020 22:30 | 0.125 |
| 30.11.2020 22:15 | 0.125 |
© Bayerisches Landesamt für Umwelt 2024